;%20}%20%3c/style%3e%3clinearGradient%20id='linear-gradient'%20x1='2.99'%20y1='29.35'%20x2='127.75'%20y2='101.39'%20gradientUnits='userSpaceOnUse'%3e%3cstop%20offset='0'%20stop-color='%23f2b347'%20/%3e%3cstop%20offset='.5'%20stop-color='%23ca5a8b'%20/%3e%3cstop%20offset='1'%20stop-color='%236654f5'%20/%3e%3c/linearGradient%3e%3c/defs%3e%3cg%20id='Layer_1-2'%20data-name='Layer%201'%3e%3cpath%20class='cls-1'%20d='M83.56,0H47.18C21.12,0,0,21.12,0,47.18v36.38c0,26.06,21.12,47.18,47.18,47.18h36.38c26.06,0,47.18-21.12,47.18-47.18V47.18C130.74,21.12,109.62,0,83.56,0ZM20.62,48.64c2.84-2.84,6.59-4.23,10.32-4.17,3.82,.07,7.55-1.1,10.25-3.8l.56-.56c2.7-2.7,3.86-6.43,3.8-10.25-.07-3.73,1.32-7.47,4.17-10.32,6.18-6.18,16.66-5.48,21.88,2.11,3.18,4.62,3.27,10.96,.19,15.64-3.02,4.6-7.92,6.78-12.72,6.54-3.51-.17-6.95,.99-9.43,3.48l-1.24,1.24c-2.48,2.48-3.65,5.92-3.48,9.43,.24,4.8-1.94,9.7-6.54,12.72-4.68,3.08-11.03,2.99-15.64-.19-7.6-5.23-8.29-15.7-2.11-21.88Zm33.7,34.25c-2.7,2.7-3.86,6.43-3.8,10.25,.07,3.73-1.32,7.47-4.17,10.32-6.18,6.18-16.66,5.48-21.88-2.11-3.18-4.62-3.27-10.96-.19-15.64,3.02-4.6,7.92-6.78,12.72-6.54,3.51,.17,6.94-.99,9.43-3.48l1.24-1.24c2.48-2.48,3.65-5.92,3.48-9.43-.24-4.8,1.94-9.7,6.54-12.72,4.68-3.08,11.03-2.99,15.64,.19,7.6,5.23,8.3,15.7,2.11,21.88-2.84,2.84-6.59,4.23-10.32,4.17-3.82-.07-7.55,1.1-10.25,3.8l-.56,.56Zm55.8-2.93c-2.96,2.96-6.91,4.35-10.79,4.15-3.51-.17-6.96,.99-9.44,3.48l-1.23,1.23c-2.49,2.49-3.65,5.93-3.48,9.44,.19,3.88-1.19,7.82-4.15,10.79-6.18,6.18-16.66,5.48-21.88-2.11-3.18-4.62-3.27-10.96-.19-15.64,3.02-4.6,7.92-6.78,12.72-6.54,3.51,.17,6.95-.99,9.43-3.48l1.24-1.24c2.48-2.48,3.65-5.92,3.48-9.43-.24-4.8,1.94-9.69,6.54-12.72,4.68-3.08,11.03-2.99,15.64,.19,7.6,5.23,8.3,15.7,2.11,21.88Z'%20/%3e%3c/g%3e%3c/svg%3e)


Reporting Best Practices
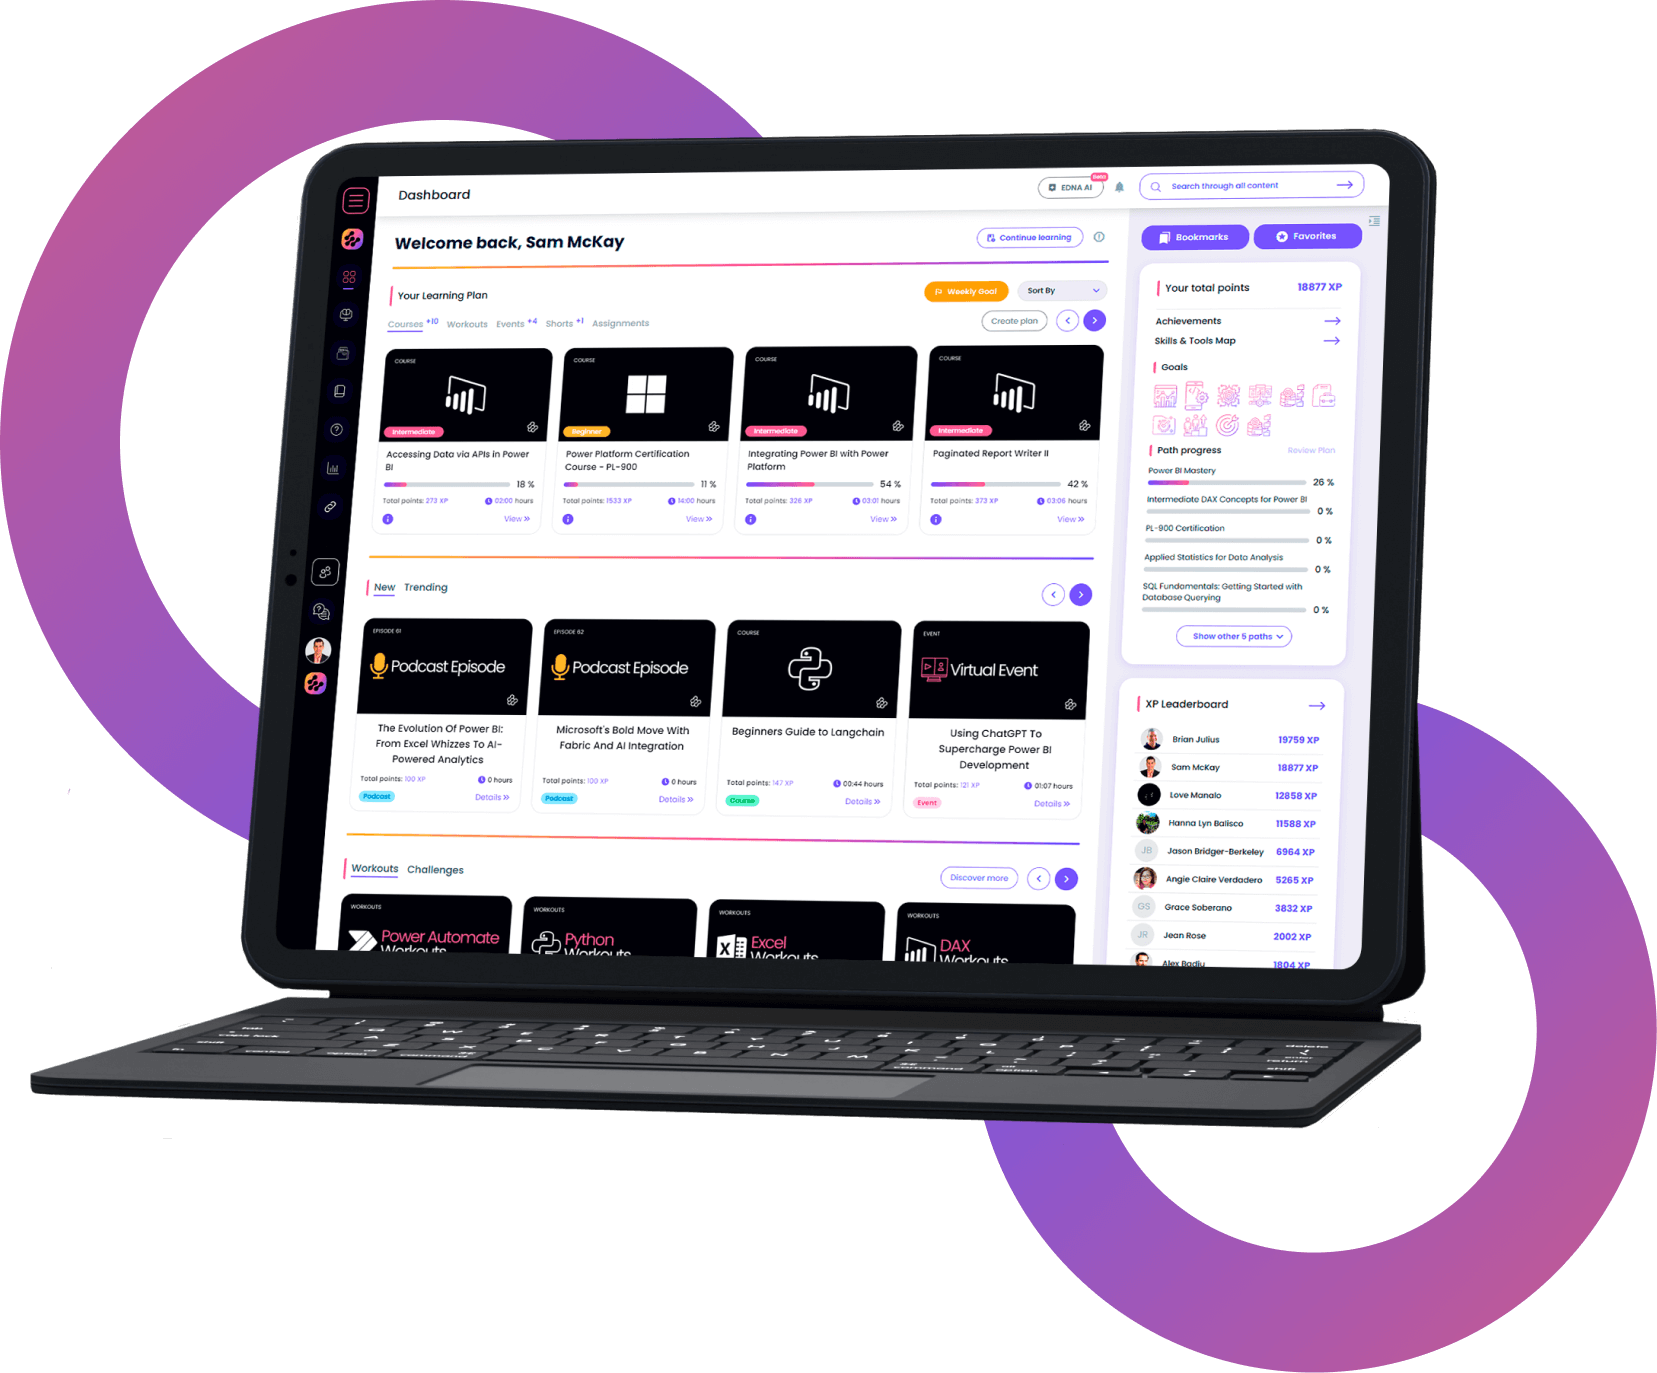
I’d like to present some Power BI report examples and best practices. In my own Power BI learning over the years, I’ve consumed many online resources which have been instrumental.
Trusted by 220,000+ people worldwide.
I’d like to present some Power BI report examples and best practices. In my own Power BI learning over the years, I’ve consumed many online resources which have been instrumental.
What our
Students Say
Curriculum
Reporting Best Practices
Your
Instructor

Greg Philps
Enterprise DNA Expert
- Consulted on many IT projects using the Microsoft BI stack to the Canadian federal government since 2009, and used Power BI exclusively since 2020.
- Skilled at developing and implementing clear and simple data transformation logic, data cleansing routines, and data models, using DAX, Power Query, and paginated reports.
- Extensive experience as well with other Microsoft BI tools, including those for the design, development, and deployment of data warehouses (SSAS), ETL packages (SSIS), SQL queries (SSMS), and reports (SSRS).
- A recognized expert in the use of the Deneb custom visual within Power BI, and author of numerous Deneb\Vega-Lite-focused media (YouTube videos, templates, workouts, and the first Deneb course available worldwide)
Frequently Asked
Questions
What’s the difference between a free account and a paid plan?
Do I need to know anything about data science or data analytics to get started with Enterprise DNA?
How will I be charged?
Can I get an invoice for my company?
Are refunds available?
Will AI take over the world and make data skills worthless?
Recommended
Labs

Budgeting in Power BI
Analyze seasonal budget trends in Power BI by utilizing variables to manipulate data and represent the relationships between data tables.


Visual Interactions
Using Power BI visual interactions allows you to showcase data in a way that’s both compelling and easy to digest.

Virtual Relationships using TREATAS
The TREATAS function in DAX is one of the most interesting DAX formulas that you can utilise inside your Power BI models.
Get full access to unparalleled
training & skill-building resources
FOR INDIVIDUALS
Enterprise DNA
For Individuals
Empowering the most valuable data analysts to expand their analytical thinking and insight generation possibilities.
Learn MoreFOR BUSINESS
Enterprise DNA
For Business
Training, tools, and guidance to unify and upskill the data analysts in your workplace.
Learn More