;%20}%20%3c/style%3e%3clinearGradient%20id='linear-gradient'%20x1='2.99'%20y1='29.35'%20x2='127.75'%20y2='101.39'%20gradientUnits='userSpaceOnUse'%3e%3cstop%20offset='0'%20stop-color='%23f2b347'%20/%3e%3cstop%20offset='.5'%20stop-color='%23ca5a8b'%20/%3e%3cstop%20offset='1'%20stop-color='%236654f5'%20/%3e%3c/linearGradient%3e%3c/defs%3e%3cg%20id='Layer_1-2'%20data-name='Layer%201'%3e%3cpath%20class='cls-1'%20d='M83.56,0H47.18C21.12,0,0,21.12,0,47.18v36.38c0,26.06,21.12,47.18,47.18,47.18h36.38c26.06,0,47.18-21.12,47.18-47.18V47.18C130.74,21.12,109.62,0,83.56,0ZM20.62,48.64c2.84-2.84,6.59-4.23,10.32-4.17,3.82,.07,7.55-1.1,10.25-3.8l.56-.56c2.7-2.7,3.86-6.43,3.8-10.25-.07-3.73,1.32-7.47,4.17-10.32,6.18-6.18,16.66-5.48,21.88,2.11,3.18,4.62,3.27,10.96,.19,15.64-3.02,4.6-7.92,6.78-12.72,6.54-3.51-.17-6.95,.99-9.43,3.48l-1.24,1.24c-2.48,2.48-3.65,5.92-3.48,9.43,.24,4.8-1.94,9.7-6.54,12.72-4.68,3.08-11.03,2.99-15.64-.19-7.6-5.23-8.29-15.7-2.11-21.88Zm33.7,34.25c-2.7,2.7-3.86,6.43-3.8,10.25,.07,3.73-1.32,7.47-4.17,10.32-6.18,6.18-16.66,5.48-21.88-2.11-3.18-4.62-3.27-10.96-.19-15.64,3.02-4.6,7.92-6.78,12.72-6.54,3.51,.17,6.94-.99,9.43-3.48l1.24-1.24c2.48-2.48,3.65-5.92,3.48-9.43-.24-4.8,1.94-9.7,6.54-12.72,4.68-3.08,11.03-2.99,15.64,.19,7.6,5.23,8.3,15.7,2.11,21.88-2.84,2.84-6.59,4.23-10.32,4.17-3.82-.07-7.55,1.1-10.25,3.8l-.56,.56Zm55.8-2.93c-2.96,2.96-6.91,4.35-10.79,4.15-3.51-.17-6.96,.99-9.44,3.48l-1.23,1.23c-2.49,2.49-3.65,5.93-3.48,9.44,.19,3.88-1.19,7.82-4.15,10.79-6.18,6.18-16.66,5.48-21.88-2.11-3.18-4.62-3.27-10.96-.19-15.64,3.02-4.6,7.92-6.78,12.72-6.54,3.51,.17,6.95-.99,9.43-3.48l1.24-1.24c2.48-2.48,3.65-5.92,3.48-9.43-.24-4.8,1.94-9.69,6.54-12.72,4.68-3.08,11.03-2.99,15.64,.19,7.6,5.23,8.3,15.7,2.11,21.88Z'%20/%3e%3c/g%3e%3c/svg%3e)


Showcase
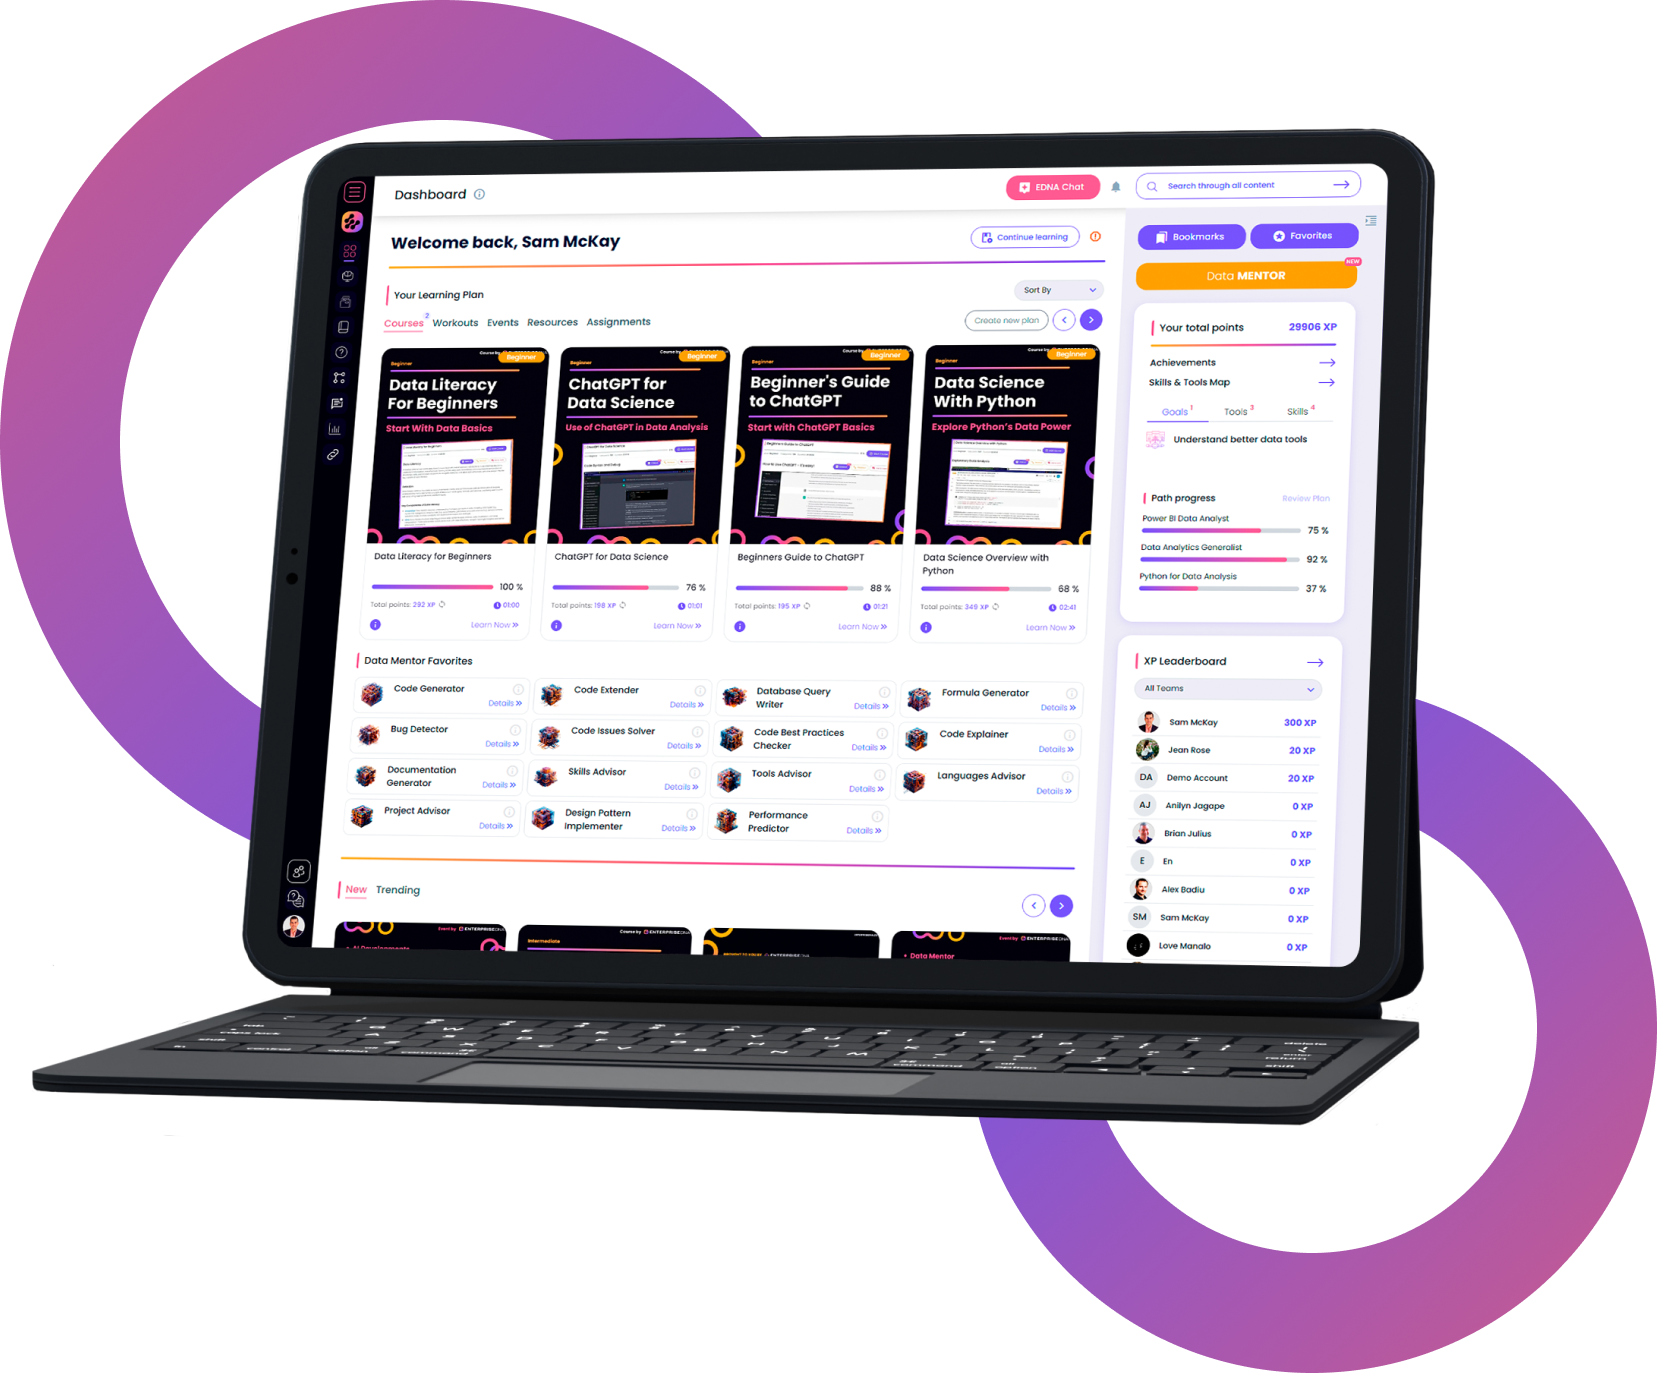
Environmental Insights Dashboard
The Environmental Insights Dashboard is a well-organized dashboard that uses easy navigation features, landing pages, and side icons to show the effects of environmental issues on human health in the past 16 years in summary statistics. The dashboard's design is visually appealing, making it easy for users to engage with the data and gain insights quickly. The dashboard features a range of summary statistics, including air pollution levels, water contamination, and waste disposal rates.
The Environmental Insights Dashboard is an essential tool for policymakers, public health officials, and other stakeholders who need to understand the effects of environmental issues on human health. The dashboard's design is intuitive, making it easy to navigate and understand. The dashboard's use of landing pages and side icons allows users to access specific data points quickly and efficiently, enabling them to make informed decisions based on real-time data. Overall, the Environmental Insights Dashboard is a powerful tool that can help organizations and individuals make data-driven decisions that can lead to a more sustainable and healthier future.

What our Students Say
Latest Showcases
Loading
Frequently Asked
Questions
What’s the difference between a free account and a paid plan?
Do I need to know anything about data science or data analytics to get started with Enterprise DNA?
How will I be charged?
Can I get an invoice for my company?
Are refunds available?
Will AI take over the world and make data skills worthless?
Get full access to unparalleled
training & skill-building resources
FOR INDIVIDUALS
Enterprise DNA
For Individuals
Empowering the most valuable data analysts to expand their analytical thinking and insight generation possibilities.
Learn MoreFOR BUSINESS
Enterprise DNA
For Business
Training, tools, and guidance to unify and upskill the data analysts in your workplace.
Learn More