
Software for Tracking Profitability by Client Account
AI connects time, expenses, and billing data to show which clients are profitable in real-time and where margins are bleeding.
You know the number on the invoice. You know the hours logged in Harvest or Clockify. You know what the media buy cost and what the freelancer charged. But ask which three clients made you money last quarter and which two lost you money, and you’re opening five tabs, exporting three CSVs, and building a pivot table that’s stale the moment you close it.
Most agency owners I work with can tell me their top-line revenue within 10 seconds. Profitability by client account takes them two days and a spreadsheet they don’t trust. The gap between those two numbers is where $60,000 to $180,000 leaks out every year in a firm doing $1 million to $25 million.
The manual work isn’t just slow. It’s incomplete. By the time you’ve reconciled time against billings and backed out expenses, the account manager has already renewed the retainer or the client has churned. You’re flying blind until month-end close, and by then the decisions that mattered have already been made.
AI changes the equation. Not by replacing your finance team, but by connecting the systems you already use and surfacing the profitability picture in real-time. Time tracking, expense logs, billing records, and project budgets flow into a single view. You see margin by client, by project, by account manager. You see it today, not three weeks from now.
This is what software for tracking profitability by client account looks like when an AI agent does the work. Let’s walk through the manual process first, then show you what changes.
The Manual Profitability Stack
Your agency runs on a patchwork. Time goes into one tool. Expenses go into another. Invoices live in a third. Project budgets might be in a spreadsheet, a PM tool, or someone’s head. Reconciling those sources into a profitability view is a monthly ritual that no one enjoys and everyone resents.
Here’s the typical sequence. Your finance lead or operations manager exports timesheets from the time-tracking tool. They pull invoices from QuickBooks or Xero. They grab expense reports from Expensify or a shared folder. They open the media buy log. They cross-reference project codes, client names, and date ranges. They build a spreadsheet that shows hours logged, hourly rates, total cost, total billed, and margin.
The process takes four to eight hours for a 15-client book. If your account managers log time inconsistently or use the wrong project codes, add another two hours of cleanup. If a freelancer invoice came in late or a media buy got reclassified, the numbers shift and you start over.
By the time the spreadsheet is done, it’s a snapshot of last month. It doesn’t tell you what’s happening this week. It doesn’t flag the client who’s burning hours faster than the retainer covers. It doesn’t surface the account where scope creep has been eating margin for three months. You get a rearview mirror, not a dashboard.
And then next month you do it again. Same exports, same pivot tables, same reconciliation. The work compounds because every month is a new build. There’s no system that remembers last month’s logic or updates itself when new data arrives.
This is the profitability tracking problem. It’s not that you can’t do it. It’s that doing it manually makes it too slow to be useful and too brittle to trust. See Omni for marketing and creative agencies to understand how AI removes the manual reconciliation layer entirely.
What an AI Agent Does Differently
An AI agent doesn’t replace your finance lead. It replaces the four to eight hours of export, match, and reconcile work. It connects to your time tracker, your billing system, your expense tool, and your project management platform. It pulls the data, maps the fields, reconciles the records, and updates the profitability view in real-time.
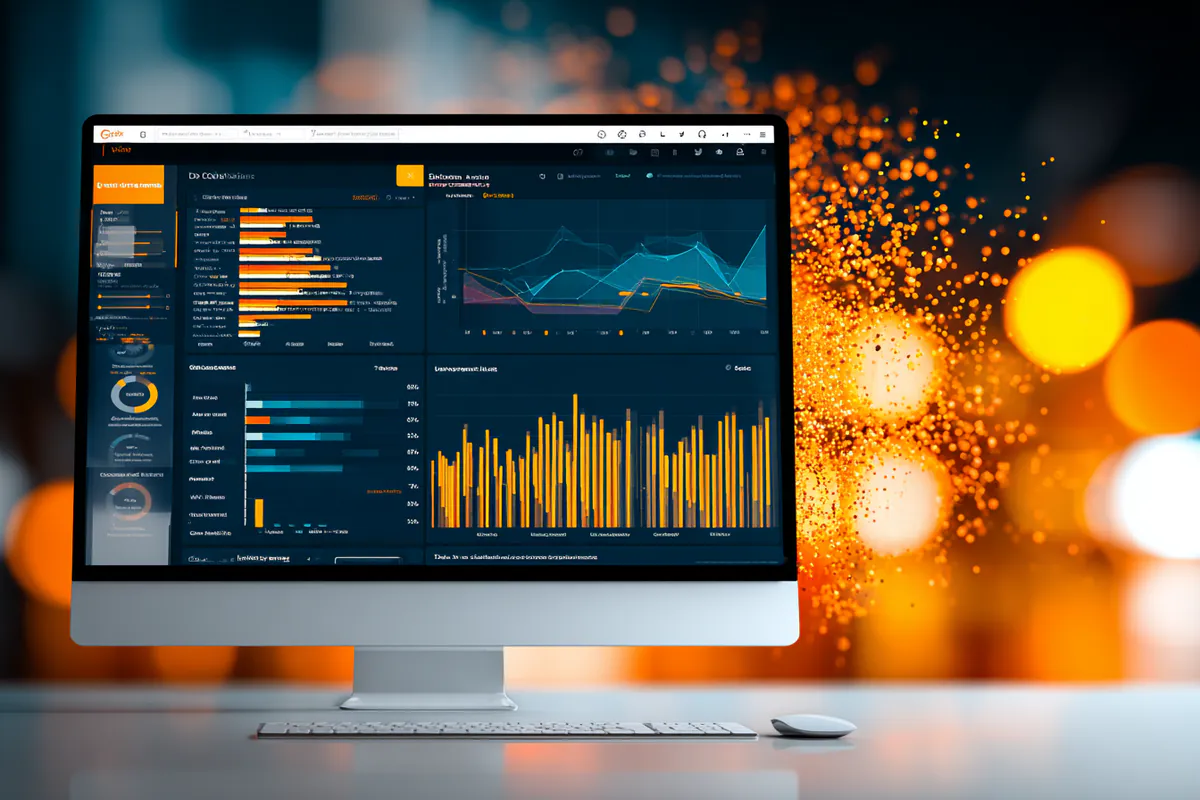
You don’t export anything. You don’t build a pivot table. You open a dashboard or ask a question in plain language, and the agent shows you margin by client, by project, by account manager, by month. The data is live. When a timesheet gets logged or an invoice gets paid, the profitability view updates.
The agent we build for this use case is the Account Health Agent. It runs daily. It watches every client account for signals that margin is compressing or opportunity is emerging. It calculates actual cost against budget, flags accounts where hours are tracking above plan, and drafts the next-step message for the account manager before they have to ask.
Here’s what that looks like in practice. Your retainer client has a $10,000 monthly budget. The Account Health Agent sees that your team has logged 62 hours in the first three weeks of the month, and your blended rate is $175. That’s $10,850 in cost against a $10,000 retainer. The agent flags the account, calculates the margin shortfall, and drafts a message to the account manager: “Client X is tracking 8.5 percent over budget this month. Consider scoping down deliverables for week four or flagging the overage in Friday’s check-in.”
The account manager didn’t have to open the time tracker. They didn’t have to calculate the burn rate. The agent did the math, surfaced the risk, and suggested the next step. The AM decides whether to act, but the work of noticing and quantifying is automated.
Now extend that across 15 clients. The Account Health Agent runs the same profitability check for every account, every day. It flags the three clients where margin is compressing. It highlights the two clients where hours are trending under budget and there’s room to upsell. It drafts the summary email for your Monday ops meeting. You see the full profitability picture without building a spreadsheet.
The Three Profitability Leaks AI Catches
Profitability doesn’t disappear in one big decision. It leaks in small, repeated patterns that are invisible until you reconcile the numbers at month-end. AI catches those leaks in real-time because it’s watching every transaction, every timesheet, every expense as it happens.
Scope creep without rate adjustment. Your client asks for one more revision, one more asset, one more round of feedback. Your team says yes because the relationship matters. The hours pile up. The retainer doesn’t change. By month-end, you’ve delivered $14,000 in work for a $10,000 retainer. The Account Health Agent flags this in week two, when the pattern starts. It shows the account manager the hour burn rate, the budget shortfall, and the margin impact. The AM can have the conversation before the month closes.
Inconsistent time tracking. Your team logs time in batches at the end of the week, or they forget to log time entirely. The profitability view is incomplete. The agent doesn’t fix time tracking discipline, but it does flag accounts where logged hours don’t match expected workload. If a designer is delivering three assets a week but logging four hours total, the agent surfaces the gap. You can correct the record before invoicing.
Expense allocation errors. A media buy gets charged to the wrong client code. A freelancer invoice sits in the wrong project bucket. The profitability report shows a healthy margin on Client A and a loss on Client B, but the reality is reversed. The Account Health Agent cross-references expense records against project codes and client names. It flags mismatches and suggests corrections. You reconcile in real-time instead of discovering the error three months later during an audit.
These three leaks account for the majority of the $60,000 to $180,000 annual loss in agencies doing $1 million to $25 million. The numbers aren’t dramatic on any single account in any single month. But compounded across a client book and across a year, they’re the difference between a 15 percent margin and a 25 percent margin.
AI doesn’t prevent scope creep or force your team to log time. It makes the leaks visible when they’re small enough to fix. That’s the value. Not perfection, but early warning.
How This Connects to the Rest of Your Operations
Profitability tracking doesn’t live in isolation. It’s downstream of time tracking, project scoping, and client communication. It’s upstream of pricing decisions, hiring plans, and client renewals. An AI agent that tracks profitability by client account becomes the hub that connects those workflows.
The Reporting Agent pulls performance data from every connected platform and drafts the monthly report for each client. It knows which accounts are profitable and which aren’t because it shares the same data layer as the Account Health Agent. When it drafts the report, it can flag margin concerns or highlight upsell opportunities in context. The account manager gets a report that’s not just performance metrics but business intelligence.
The Content Production Agent produces first-pass content from briefs. It doesn’t track profitability directly, but it reduces the per-asset cost that kills margin on content-heavy accounts. If your team is spending eight hours per blog post and your retainer assumes four hours, the Content Production Agent brings that cost down by handling research, first draft, and formatting. The Account Health Agent sees the time savings and updates the profitability view accordingly.
This is the Omni Ops layer. It’s not one agent doing one task. It’s a system of agents that share data, coordinate workflows, and surface insights across your operations. Profitability tracking is one output. Faster reporting is another. Lower content cost is a third. They all feed the same goal, which is running a more profitable agency without adding headcount. You can explore the full Omni Ops platform to see how these agents connect.
What the Omni Audit Uncovers
When I sit down with an agency owner for an Omni Audit, we don’t start with technology. We start with their client book. How many active accounts? What’s the retainer mix versus project work? Where do they think they’re losing margin?
Most owners have a gut sense. They know Client X is a pain and probably not profitable. They know Client Y is easy and probably a good margin. But they don’t have the numbers to confirm it, and they don’t have a system that would tell them if the situation changed.
The audit maps their current profitability tracking process. We walk through the tools, the exports, the spreadsheets, the reconciliation steps. We time it. We identify the gaps, the manual handoffs, the places where data gets lost or delayed. Then we design the AI workflow that replaces the manual work.
For profitability tracking, that workflow typically includes three components. First, we connect the time tracker, billing system, and expense tool to a shared data layer. Second, we configure the Account Health Agent to calculate margin by client and flag accounts that are trending off-budget. Third, we build the dashboard or the natural-language interface that lets the owner or ops manager ask questions and get answers in seconds.
The output isn’t a deck. It’s a working prototype of the agent, a workflow map that shows what gets automated and what stays manual, and a cost-benefit model that shows the time saved and the margin recovered. You leave the audit with a plan you can implement, not a strategy you have to translate.
The Dollar Reality
Let’s put numbers to this. Your agency does $5 million in revenue. You run 20 active client accounts. Your blended margin is 18 percent, which is $900,000 in gross profit. You know some clients are better than others, but you don’t have real-time visibility into which ones are profitable and which ones are bleeding margin.
Your ops manager spends six hours a month reconciling time, expenses, and billings into a profitability report. That’s 72 hours a year, or about $7,200 in fully loaded cost at a $100 hourly rate. But the bigger cost is the delayed insight. You don’t see margin compression until month-end. By the time you spot the problem, you’ve already lost the margin.
Let’s say three of your 20 clients are unprofitable, and you don’t realize it until Q2 close. Each of those clients is losing you $1,000 a month in margin shortfall. That’s $3,000 a month, or $36,000 a year. Add the ops manager’s reconciliation time, and you’re at $43,200 in direct cost.
Now add the opportunity cost. Two of your profitable clients have room to upsell, but you don’t see it because you’re not tracking profitability in real-time. Each upsell is worth $2,000 a month in additional retainer. That’s $4,000 a month, or $48,000 a year in revenue you’re leaving on the table.
Total annual leakage: $91,200. That’s in the middle of the $60,000 to $180,000 band for agencies in your revenue range. It’s not a crisis. It’s a slow bleed that compounds over time.
An AI agent that tracks profitability by client account in real-time eliminates the reconciliation work, flags the unprofitable clients in week two instead of month-end, and surfaces the upsell opportunities before your competitors do. The cost to build and run that agent is a fraction of the leakage it recovers. The payback period is typically three to six months.
This is the business case for the AI audit for marketing and creative agencies. It’s not about adopting AI because it’s trendy. It’s about recovering the $60,000 to $180,000 that’s leaking out of your operations every year because profitability tracking is too slow and too manual to be useful.
What Happens After the Audit
The audit is the starting point. You leave with a workflow map, a prototype agent, and a cost-benefit model. The next step is implementation. We build the full agent, connect it to your systems, train your team, and deploy it into production.
Implementation typically takes four to eight weeks depending on the complexity of your tool stack and the number of clients in your book. We start with a pilot, usually three to five clients. We validate that the agent is pulling the right data, calculating margin correctly, and flagging the right signals. We iterate based on feedback from your ops manager and account managers. Then we roll it out to the full client book.
Once the agent is live, your ops manager’s monthly reconciliation work drops from six hours to 30 minutes. The 30 minutes is review and exception handling, not data entry and pivot tables. Your account managers get daily margin updates and proactive flags for accounts that are trending off-budget. Your leadership team gets a real-time profitability dashboard that shows margin by client, by account manager, by service line.
The system improves over time. The agent learns your client patterns, your billing cycles, your expense categories. It gets better at predicting which accounts are at risk and which accounts have upsell potential. You’re not maintaining a static spreadsheet. You’re running a dynamic profitability engine that adapts to your business.
This is what AI operations look like in practice. Not a chatbot, not a dashboard you check once a month, but a working system that does the repetitive profitability work so your team can focus on the decisions that matter. You can explore more use cases and workflows in the EDNA insights library or dive into the technical architecture in the learning hub.
The Path Forward
If you’re still reconciling profitability in a spreadsheet three weeks after month-end, you’re flying blind. You don’t know which clients are making you money and which ones are costing you money until it’s too late to steer. You’re reacting instead of leading.
AI gives you the profitability view in real-time. It connects your time tracker, your billing system, and your expense tool. It calculates margin by client, by project, by account manager. It flags the accounts that are bleeding margin and the accounts that have room to grow. It drafts the next-step message for your account managers. It updates the dashboard every day.
The work doesn’t go away. Profitability still requires discipline in time tracking, accuracy in expense allocation, and judgment in pricing decisions. But the manual reconciliation work, the four to eight hours a month of export and pivot, that work disappears. The agent does it in seconds, and it does it every day instead of once a month.
The dollar impact is real. Recovering $60,000 to $180,000 a year in margin leakage is the difference between a good year and a great year. It’s the difference between hiring another account manager because you have to and hiring another account manager because you want to.
For a deeper walkthrough of tools like this and how they fit together, the free Working With Claude field guide covers the ecosystem end to end. Get the guide.