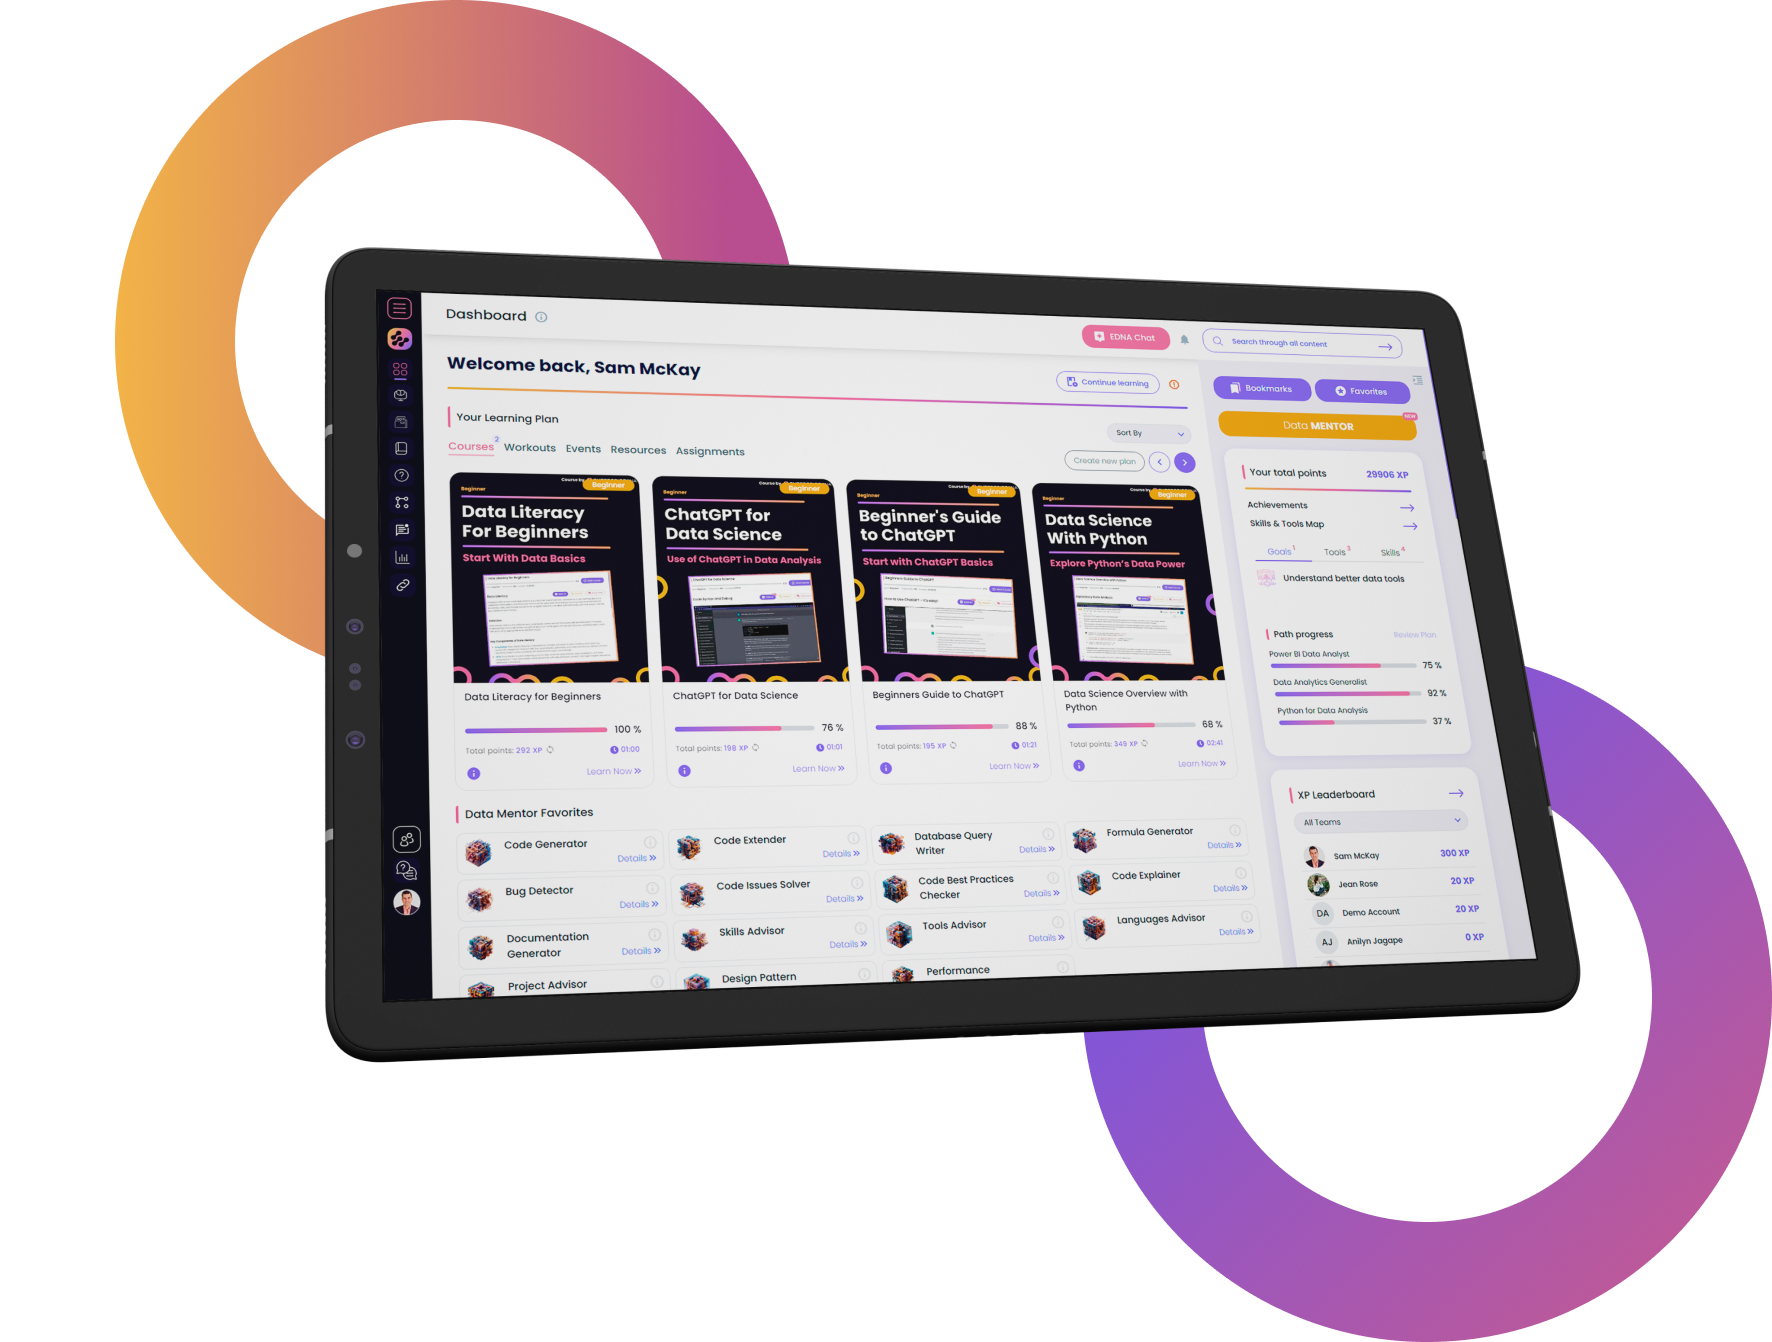
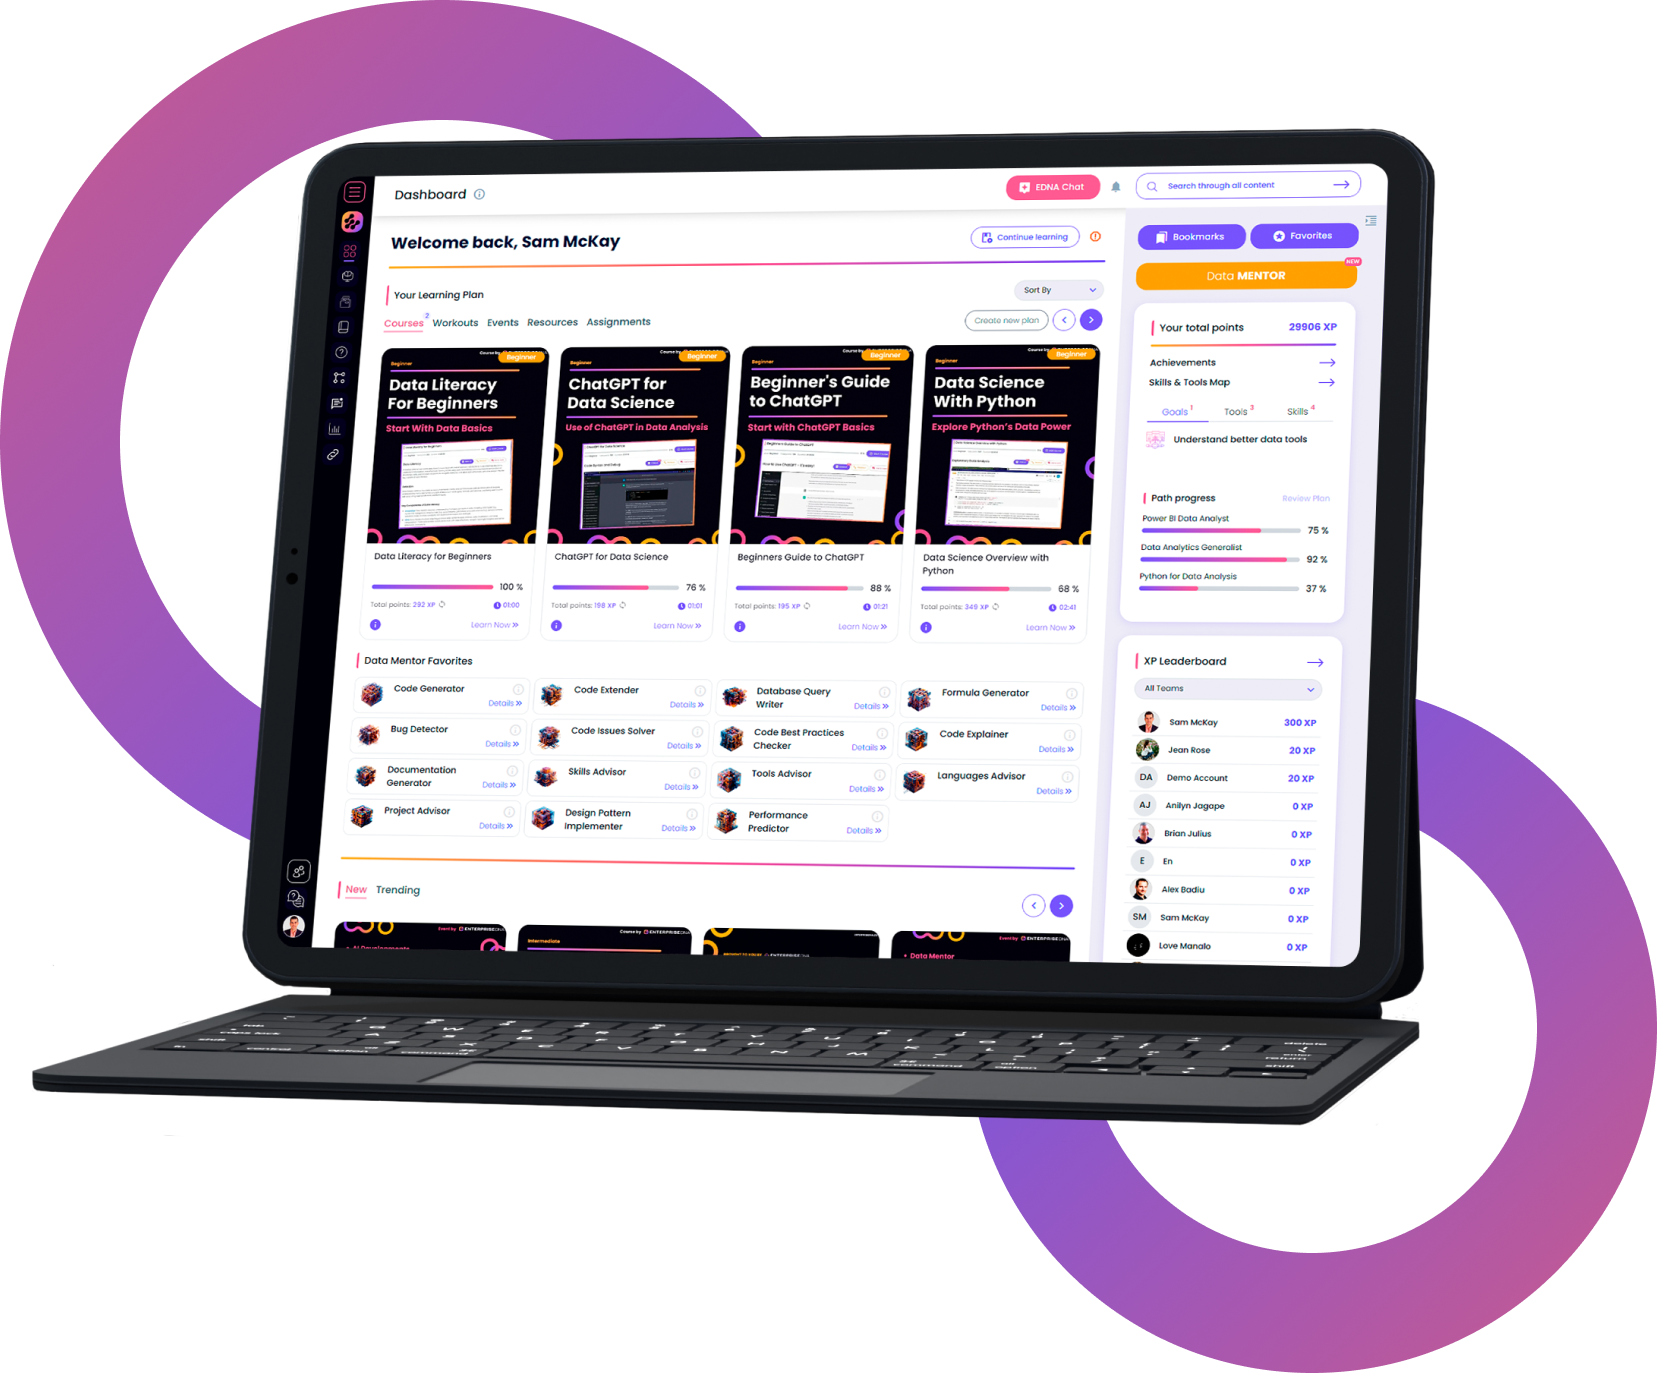
infographics
R Stats and Graphics - Detailed Guide
This detailed guide offers a thorough understanding of integrating R with Power BI for advanced analytics and visualization. It begins with the fundamentals of R and Power BI integration, including setup requirements and basic R scripting. The guide then delves into crucial areas such as data import and preparation, creating custom visuals with ggplot2, and enhancing Power BI reports with R scripts.
Users are guided through various statistical techniques, from descriptive statistics to inferential methods like t-tests, all implemented within the Power BI environment. The resource covers the creation of interactive R visuals, statistical data validation, and efficient data manipulation using dplyr.
Advanced topics include visual design considerations, script writing and debugging techniques, and implementing predictive analytics with R in Power BI. The guide culminates with a capstone project, allowing users to apply their skills to real-world business problems.
Additionally, the resource addresses common troubleshooting issues and provides best practices for building effective BI solutions that integrate R. By following this guide, users can significantly enhance their data modeling and analytical capabilities in Power BI, gaining deeper insights and making more informed, data-driven decisions.
What our Students Say
Your Author
EDNA Team
Data & AI
Frequently Asked
Questions
What’s the difference between a free account and a paid plan?
Do I need to know anything about data science or data analytics to get started with Enterprise DNA?
How will I be charged?
Can I get an invoice for my company?
Are refunds available?
Will AI take over the world and make data skills worthless?
Get full access to unparalleled
training & skill-building resources

FOR INDIVIDUALS
Enterprise DNA
For Individuals
Empowering the most valuable data analysts to expand their analytical thinking and insight generation possibilities.
Learn MoreFOR BUSINESS
Enterprise DNA
For Business
Training, tools, and guidance to unify and upskill the data analysts in your workplace.
Learn More
Latest Guides
Loading


