Power BI

Showcases

Discover what can be done with data and get inspired by an expansive range of interactive showcases.

Let’s create your free account

OR

By continuing, you accept our Enterprise DNA Terms & Conditions , our Privacy & Cookie Policy and that your data is stored.

If you have an account Login here

You can access ALL these Power BI solutions through Enterprise DNA's Education Platform

Latest Power BI showcases

from Enterprise DNA
Cover: Accounts Receivable Reconciliation

Accounts Receivable Reconciliation

Review historic or future cash forecasts. Select date and dynamically calculate the expected account receivable with various breakdown possibilities.
Cover: Advanced Budgeting

Advanced Budgeting

Compare actual results to budgets.Distribute budgets across year according to seasonality within data. Complex analytical techniques

Cover: Advertising Campaigns

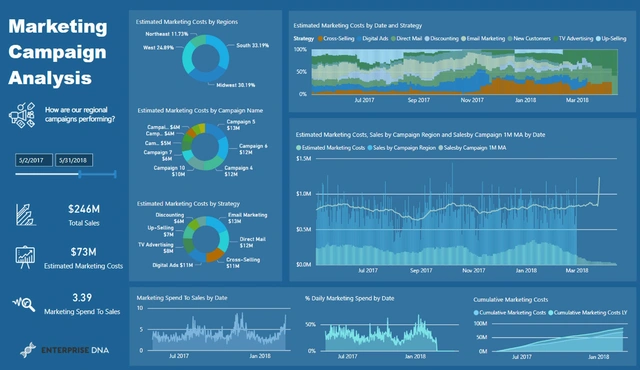
Advertising Campaigns

Gain insights into your marketing initiatives by comparing campaign performance over time.

Cover: Banking Clients & Risk Analysis

Banking Clients & Risk Analysis

Total review of all banking credit risks, for management reporting and relationship banking dashboards. Drill into clients by relationship, location, risk weighting and more. Identify credit risk at the regional level and/or drill into data at the individual client level.

Cover: Call Center Insights

Call Center Insights

Review call center performance by analysing key metrics such as abandon rate, satisfaction score, SLA, and average answer speed.

Cover: Client Insight

Client Insight

Learn everything you need to know on your customer data. Understand which sales are occurring in which sales regions. Analyse trends over time, how customer sales are tracking versus last year and customer profitability. Compare results versus individual customers and within regions.

Cover: Client Satisfaction

Client Satisfaction

Monitor what category is generating the most complaints, how long complaints are waiting to be resolved and who's taking days to offer solution.

Cover: Cohort Analysis

Cohort Analysis

Advanced cohort insights for software as a service organization. Understand customer churn and also retention dynamically across different regions.

Cover: Consumer Goods

Consumer Goods

Sales analysis for FMCG business selling throughout the US. Drill into sales performance of each region or state. Watch key sales metrics as they happen and look for emerging trends in the performance of products or customers.

Cover: Country Overviews

Country Overviews

Highlight performance divergence across regional and country centers. Slice information by key products and sales groups to identify trends

Cover: COVID 19 Global Dashboard

COVID 19 Global Dashboard

Explore COVID 19's impact by demographics with a special focus on its effects by race/ethnicity in different facets of life, using advanced machine learning techniques.

Cover: COVID 19 Global Report

COVID 19 Global Report

Analyze the COVID 19 global report that compares key metrics between regional and global levels.

Cover: COVID 19 Reporting

COVID 19 Reporting

Analyze how countries dealt with COVID-19 through visuals, narratives, regression models, dynamic report level tool-tips, navigations, and maps.

Cover: CRM Sales Data

CRM Sales Data

Detailed analysis on customer relationship management (CRM) sales data. Understand where your sales have derived from, where the next opportunities are and be on top of the probabilities and financial implications of successful future sales pursuits.

Cover: Currency Conversion

Currency Conversion

Showcase waste management with clients around the globe using progressive disclosure technique.

Cover: Customer Engagement

Customer Engagement

Understand the correlation between sales and customer engagement with your email marketing strategy.

Cover: Customer Insights

Customer Insights

Compare Sales vs Engagement. Determine how your marketing strategy impacts your sales.

Cover: Data Documentation Dashboard

Data Documentation Dashboard

Dynamic visual overview of the data documentation collected through advanced scripting.

Cover: Delivery App Review

Delivery App Review

Choose the warehouse where to source your products by identifying each warehouse' location and distance fromwhere the store is located.

Cover: Delivery Application

Delivery Application

Select a warehouse and see all the deliveries over a certain timeframe, number of damaged products, returns, and average delivery minutes per day.

Cover: Detecting Outliers

Detecting Outliers

Detect outliers or anomalies within your data. Showcase trends and change over time for this abnormal results