Enterprise DNA Skills
Data Modeling
Create a logical and structured representation of data, enabling organizations to better understand and manage their data assets.
Start Learning for Free
New to Data Modeling?
Start here.

Paid Course
Introduction to Deep Learning with Artificial Neural Networks
Transform your proficiency with our exclusive neural network course! Uncover the intricacies of deep learning and position yourself as a pioneer in the realm of AI evolution!
Learning
Paths
Path

Python for Data Analysis
Take your data analysis to the next level with Python. Seamlessly integrate Python and AI for efficient workflows and game-changing insights.
Beginner
12 Hours
Path

Build No-Code Applications with Power Apps
An in-depth path for mastering Power Apps for efficient task automation and engaging user interfaces.
Intermediate
16 Hours
Path

Mastering Visualization with Power BI
Gain comprehensive knowledge in key features including data transformation, modeling, DAX calculations, and visualization. Build analytical solutions surpassing traditional reporting!
Intermediate
10 Hours
Path

Power BI & Python for Advanced Analytics
Dive deep into machine learning with Python, mastering predictive analytics and advanced data manipulations to excel in complex analytical tasks.
Advanced
7 Hours
Path

M Code for Power Query
Master the art of creating visually appealing and insightful dashboards and reports using Power BI, leveraging its wide range of visualization options and features.
Intermediate
11 Hours
Path

No-Code Automation with Power Automate
Explore into built-in connectors, mastering basic flows to advanced error handling for seamless workflow efficiency.
Advanced
9 Hours
Path

Data Analytics Generalist
Gain a versatile skill set covering a wide range of data analysis techniques and tools, preparing you for diverse roles in the dynamic field of data analytics!
Beginner
17 Hours
Path

Power BI Data Analyst
Master the skills needed to ace the PL-300 certification exam, blending foundational Power BI knowledge with advanced DAX techniques.
Beginner
19 Hours
Learning
Center
Course

Introduction to Deep Learning with Artificial Neural Networks
Transform your proficiency with our exclusive neural network course! Uncover the intricacies of deep learning and position yourself as a pioneer in the realm of AI evolution!
Intermediate
1 Hours
Course

Foundations of Data Analytics
Gain a profound understanding of the practicality and significance of data-driven insights in today's decision-making landscape
Beginner
2 Hours
Course

Integrating Power BI with Power Platform
Expand your Power BI report by integrating it with Power Platform applications to incorporate capabilities above and beyond just reporting on insights.
Intermediate
3 Hours
Course

Power BI Workshop
*NEW* Explore comprehensive Power BI desktop development techniques. From managing data sources, advanced visualization and sharing reports.
Intermediate
5 Hours
Course

Financial Reporting With Power BI
Create comprehensive financial reports in Power BI that represent key insights in a compelling and dynamic way
Advanced
6 Hours
Course

Data Transformations And Modeling
Learn how to clean, optimize and model data tables to develop effective, insightful and actionable Power BI reports
Beginner
5 Hours
Course

Machine Learning Models in Power BI
Master predictive analytics in Power BI: Learn preprocessing to advanced AutoML. Unlock powerful machine learning models and transform your data.
Intermediate
1 Hours
Course

Applied Problem Solving with Power Query/M
Deepen your Power Query/M understanding through hands-on practice. Master practical applications and excel in data transformation!
Advanced
6 Hours
Virtual
Events
Virtual Event

Power Platform Innovation Labs #3
Learn how to build scalable Power Platform solutions to implement robust business processes from the world's global experts.
07:17:46 Hours
Virtual Event

9 1/2 Tips for Awesome Visualisations in Power BI
Stop wasting your valuable time in building or deciphering confusing visualizations and increase your insight
00:43:25 Hours
Virtual Event

Building Simple Enterprise Applications
Introducing Power Automate into your development to remove manual processes
00:50:33 Hours
Virtual Event

Developing Data Models In The Real World
Discover the foundations of Data Modelling in Power BI and Power Query
00:46:19 Hours
Project
Center
Challenge

Hotels Revenue Management
Take on the challenge of creating an analysis report on hotels revenue management data.
Challenge

Customer Satisfaction and Loyalty Analytics
Analyze OmniRetail’s 2024 customer satisfaction data to uncover what drives loyalty across regions, demographics, and support experiences.
Challenge

Call Center Data Reporting
Create a report summary of the overall services provided by a Call Centre for its management
Challenge

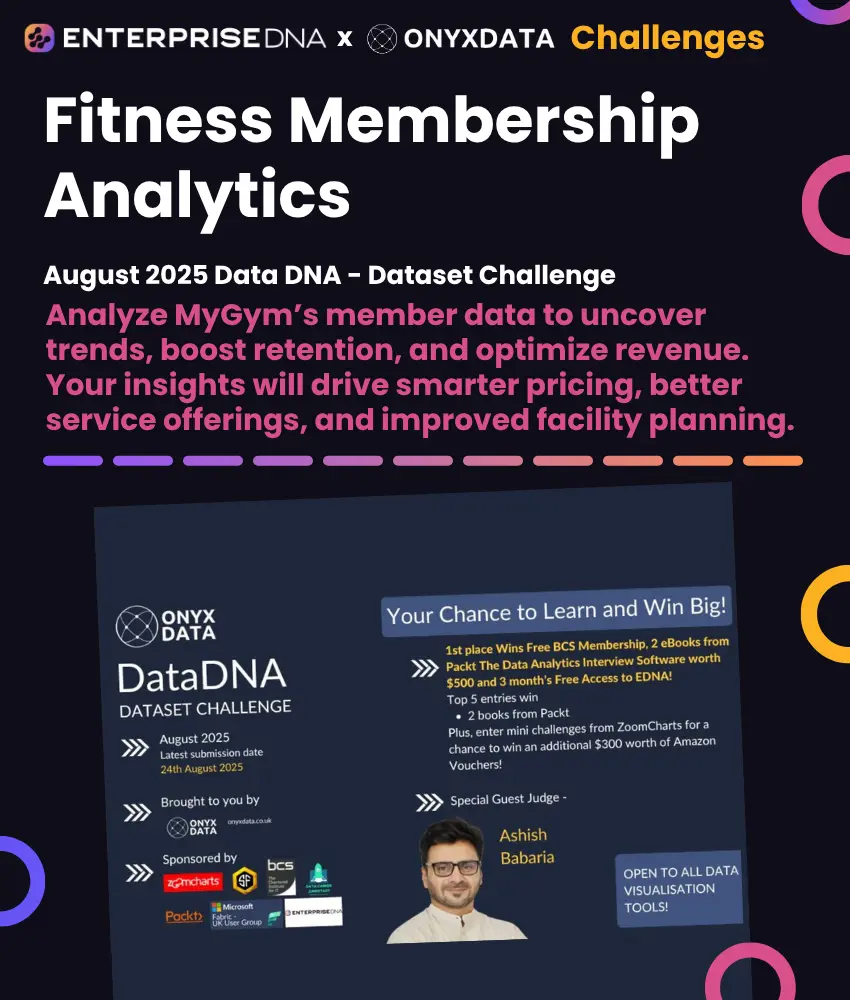
Fitness Membership Analytics
Analyze MyGym’s member data to uncover trends, boost retention, and optimize revenue. Your insights will drive smarter pricing, better service offerings, and improved facility planning.
Challenge

OEE Manufacturing Report
Work on one of the most significant measures for manufacturing productivity - OEE
Challenge

Mobile Phone Sales Dataset
Explore 2024 mobile phone sales data to uncover product trends, customer insights, and regional performance to support smarter business decisions.
Challenge

Executive Sales Report
Create a summary report, a task that for many data analysts will always find its way across the desk every so often
Challenge

Sales and Production Analysis
Implement your analytical skills in creating a report of the entire business operation from production to forecasting.
Guides
Resource

Data Model and Transformation
Learn to master data transformations, efficient modeling techniques, and DAX calculations for deeper insights!
Resource

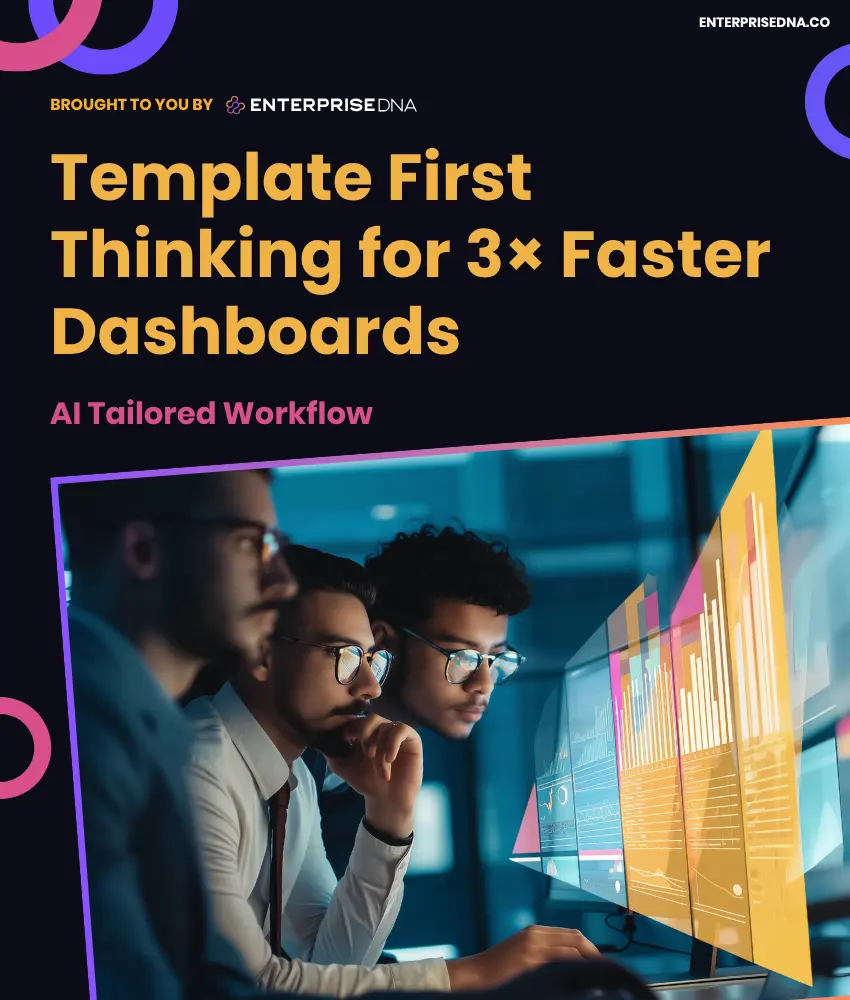
Template First Thinking for 3× Faster Dashboards
Build dashboards 3× faster with pre-built templates, branded backgrounds, and AI automation to save time and deliver insights instantly.
Resource

Data Science with Python
Learn to process and analyze data, build predictive models, and optimize their performance with Python!
Resource

Deep Learning with Artificial Neural Networks
Learn to structure neural models, optimize data processes, and apply sophisticated algorithms for enhanced predictive analytics and problem-solving!
Resource

Best Practices in Data Modeling
Learn key tips for effective Power BI data modeling, such as using a star schema, optimizing data, and avoiding overuse of calculated columns.
Resource

Power BI Super Users Workshop
Learn advanced DAX, data modeling, and interactive dashboards, providing you with the skills to build sophisticated reports and analyses!


