Enterprise DNA Tools
Other Tools
Set of training and resources on other tools specific to help you improve your data skills.
Start Learning for Free
New to Other Tools?
Start here.

Paid Course
The Ultimate Guide to Azure AI Studio
Leverage Azure's powerful AI tools to optimize your data workflows and boost automation. Automate data processing, utilize predictive analytics, and improve operational efficiency seamlessly within your existing infrastructure.
Learning
Paths
Path

Data Analytics Generalist
Gain a versatile skill set covering a wide range of data analysis techniques and tools, preparing you for diverse roles in the dynamic field of data analytics!
Beginner
17 Hours
Path

DAX for Power BI Analysis
Master the most in-depth and rigorous path on Power BI, gaining expert-level skills across all key pillars of analysis.
Intermediate
24 Hours
Path

No-Code Automation with Power Automate
Explore into built-in connectors, mastering basic flows to advanced error handling for seamless workflow efficiency.
Advanced
9 Hours
Path

Build No-Code Applications with Power Apps
An in-depth path for mastering Power Apps for efficient task automation and engaging user interfaces.
Intermediate
16 Hours
Path

Microsoft Fabric Fundamentals
Elevate your expertise in data management, analytics, and system integration. Start your transformative journey with our comprehensive courses!
Intermediate
11 Hours
Path

Workflows & Apps with ChatGPT
Seamlessly integrate this powerful AI into your favorite tools, automating tasks and boosting productivity to new heights.
Intermediate
13 Hours
Path

Power BI Data Analyst
Master the skills needed to ace the PL-300 certification exam, blending foundational Power BI knowledge with advanced DAX techniques.
Beginner
19 Hours
Path

Power BI Data Analyst
Master the skills needed to ace the PL-300 certification exam, blending foundational Power BI knowledge with advanced DAX techniques.
Beginner
19 Hours
Learning
Center
Course

The Ultimate Guide to Azure AI Studio
Leverage Azure's powerful AI tools to optimize your data workflows and boost automation. Automate data processing, utilize predictive analytics, and improve operational efficiency seamlessly within your existing infrastructure.
Intermediate
6 Hours
Course

Create Intelligent Apps with ChatGPT
Build smart apps effortlessly—combine ChatGPT with platforms like Teams, Outlook, Bubble, and Power Apps. Unleash creativity and boost functionality across your digital tools!
Intermediate
2 Hours
Course

Beginners Guide to Google Colab
Unlock the full potential of Google Colab for your data science and machine learning projects. Learn how to write, run, and share Python code effortlessly in this cloud-based environment, mastering the tools and features that make Colab a go-to resource for data professionals.
Beginner
1 Hours
Course

Dashboarding & Data Visualization Intensive
Learn how to develop complete Power BI solutions that look compelling and deeply engage your consumers in your insights
Advanced
7 Hours
Course

Building and Deploying AI-Driven Apps
Quickly build and deploy an AI‑powered web application from scratch—without heavy coding—using Lovable, Supabase, and OpenAI.
Beginner
2 Hours
Course

Mastering Automation with Power Automate
Automate tasks, integrate with Microsoft 365, and enhance operational efficiency through no-code solutions!
Beginner
12 Hours
Course

Handling Big Data with Pandas, Polars, and PySpark
PySpark made easy! Learn Pandas and Polars to navigate any dataset, uncover valuable insights, and become a data analysis powerhouse.
Beginner
1 Hours
Course

Time Series Analysis Fundamentals
Discover the power of Time Series Analysis! Learn to forecast and identify trends, gaining valuable insights into the patterns of temporal data.
Beginner
3 Hours
Virtual
Events
Podcast

Is Copilot Finally on Track & New AI Innovations Coming Out Soon
Is Copilot finally finding its stride? With new AI innovations on the horizon, the way we work might be about to change—again. Are we prepared for what’s coming, or just getting comfortable with the current wave? The future isn’t slowing down.
Podcast

How To Become A Full Stack AI Professional AI Builders
With AI, things that once took teams of engineers and thousands of dollars can be done in minutes with AI-powered development. The opportunity is massive. AI is not replacing jobs—it’s creating new ones for those who are willing to learn.
Podcast
The Analyst Role Has Changed, Here’s How to Win
Resumes don’t cut it anymore. Showcase your work, build real projects, and focus on strategy to future-proof your career.
Podcast
How MCP Loops Are Changing How We Build
Turn your plan into working software with MCP loops doing the heavy lifting.
Podcast

Why you should set up a GitHub account today.
Review why Github is going to be an essential account to have in the near future, particularly if you want to start building AI applications.
Podcast

AI Agents and MCP Are Disrupting Enterprise Software
Discover the power of AI-driven automation and low-code development in boosting productivity and driving innovation in enterprise operations.
Podcast
Code Is Leverage, How Small Teams Outbuild Giants
OpenAI, Anthropic, and new tools are reshaping tech, showing how small teams can outbuild giants with advanced automation and intelligent systems.
Podcast

Who Wins and Who Loses Early in the AI Era
We’re no longer asking if AI will change the world—it already has. The real question now? Who’s actually winning—and who’s quietly being left behind.
Project
Center
Challenge

Marketing Analytics - Measuring ROI
Analyze data from marketing campaigns and initiatives, using visualization tools and statistical analysis techniques to identify trends and patterns, and use these insights to inform marketing strategy and decision-making.
Challenge

Timesheet Utilisation Reporting
Take a deep dive into the world of utilisation and timesheet data
Challenge

Twitter Threads Analysis
Jump into this twitter related dataset and showcase some interesting insights based on the text of the tweet and the stock reference or tagged within the tweet itself.
Challenge

Social Media Content Performance
Analyze 2024 social media data to uncover what makes content perform across platforms. Show your insights, sharpen your skills, and compete for exciting prizes.
Challenge

Customer Satisfaction and Loyalty Analytics
Analyze OmniRetail’s 2024 customer satisfaction data to uncover what drives loyalty across regions, demographics, and support experiences.
Challenge

Optical Data
Provide a business solution by creating an intelligence tool to use by large opticians
Challenge

Discovering Shopper Segments
In this challenge, participants are encouraged to uncover distinctive shopper segments and present innovative insights.
Challenge

User Experience Focus - Design Creative Navigations
Create a navigation experience that showcases your brand and keeps users
coming back for more by prioritizing the user experience and considering
the needs and preferences of your target audience.
Guides
Resource
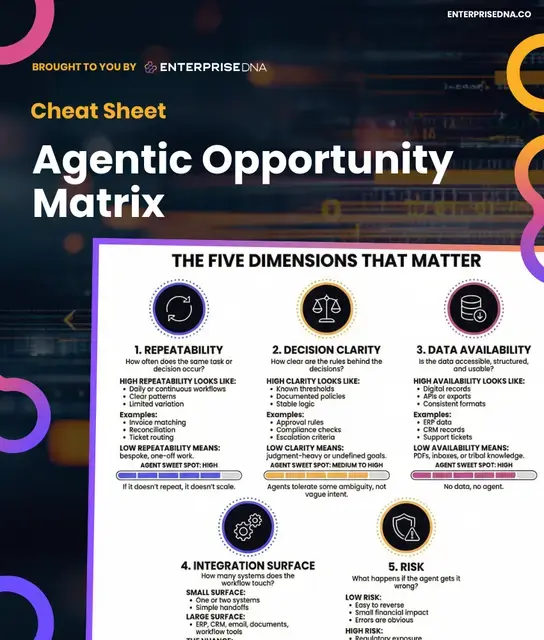
Agentic Opportunity Matrix
A practical way to assess which agentic ideas are worth building.
Resource

Turning App Ideas into Reality with Code
Turn app ideas into reality with AI-generated blueprints and rapid prototyping using Lovable or Cursor to accelerate development.
Resource

Echo Assist
A powerful desktop productivity application that combines voice typing, AI chat capabilities, and screenshot functionality.
Resource
Clean Data Like a Pro
Transform messy data into consistent, error-free insights with Power Query’s reusable functions.
Resource

Understanding Data Types for Better Insights
Learn how structured data offers quick analysis, while unstructured data requires advanced tools to unlock valuable insights.
Resource
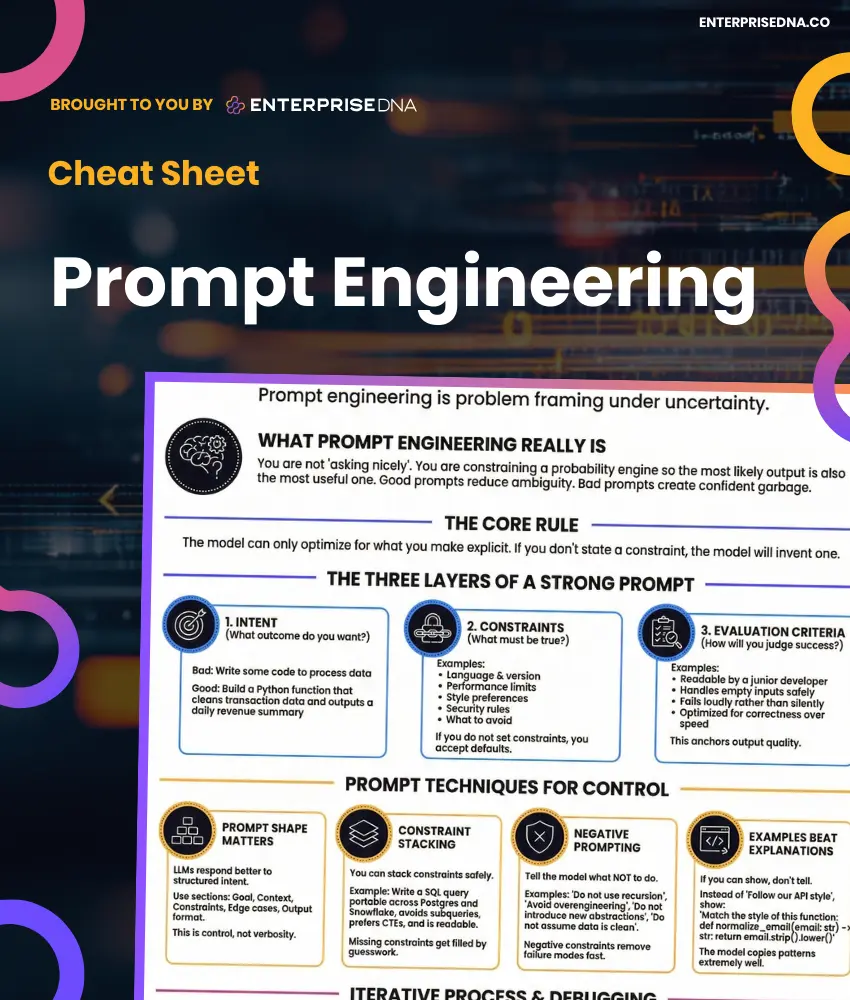
Resource

Data Visualization - Do's & Don'ts
This document provides a concise guide on the essential dos and don'ts of data visualization to enhance clarity and effectiveness in communicating insights.
Resource

Understanding Data Lakes vs. Data Warehouses
Data lakes manage unstructured data for analytics, while data warehouses handle structured data for reporting. What’s your priority: flexibility or performance?


