;%20}%20%3c/style%3e%3clinearGradient%20id='linear-gradient'%20x1='2.99'%20y1='29.35'%20x2='127.75'%20y2='101.39'%20gradientUnits='userSpaceOnUse'%3e%3cstop%20offset='0'%20stop-color='%23f2b347'%20/%3e%3cstop%20offset='.5'%20stop-color='%23ca5a8b'%20/%3e%3cstop%20offset='1'%20stop-color='%236654f5'%20/%3e%3c/linearGradient%3e%3c/defs%3e%3cg%20id='Layer_1-2'%20data-name='Layer%201'%3e%3cpath%20class='cls-1'%20d='M83.56,0H47.18C21.12,0,0,21.12,0,47.18v36.38c0,26.06,21.12,47.18,47.18,47.18h36.38c26.06,0,47.18-21.12,47.18-47.18V47.18C130.74,21.12,109.62,0,83.56,0ZM20.62,48.64c2.84-2.84,6.59-4.23,10.32-4.17,3.82,.07,7.55-1.1,10.25-3.8l.56-.56c2.7-2.7,3.86-6.43,3.8-10.25-.07-3.73,1.32-7.47,4.17-10.32,6.18-6.18,16.66-5.48,21.88,2.11,3.18,4.62,3.27,10.96,.19,15.64-3.02,4.6-7.92,6.78-12.72,6.54-3.51-.17-6.95,.99-9.43,3.48l-1.24,1.24c-2.48,2.48-3.65,5.92-3.48,9.43,.24,4.8-1.94,9.7-6.54,12.72-4.68,3.08-11.03,2.99-15.64-.19-7.6-5.23-8.29-15.7-2.11-21.88Zm33.7,34.25c-2.7,2.7-3.86,6.43-3.8,10.25,.07,3.73-1.32,7.47-4.17,10.32-6.18,6.18-16.66,5.48-21.88-2.11-3.18-4.62-3.27-10.96-.19-15.64,3.02-4.6,7.92-6.78,12.72-6.54,3.51,.17,6.94-.99,9.43-3.48l1.24-1.24c2.48-2.48,3.65-5.92,3.48-9.43-.24-4.8,1.94-9.7,6.54-12.72,4.68-3.08,11.03-2.99,15.64,.19,7.6,5.23,8.3,15.7,2.11,21.88-2.84,2.84-6.59,4.23-10.32,4.17-3.82-.07-7.55,1.1-10.25,3.8l-.56,.56Zm55.8-2.93c-2.96,2.96-6.91,4.35-10.79,4.15-3.51-.17-6.96,.99-9.44,3.48l-1.23,1.23c-2.49,2.49-3.65,5.93-3.48,9.44,.19,3.88-1.19,7.82-4.15,10.79-6.18,6.18-16.66,5.48-21.88-2.11-3.18-4.62-3.27-10.96-.19-15.64,3.02-4.6,7.92-6.78,12.72-6.54,3.51,.17,6.95-.99,9.43-3.48l1.24-1.24c2.48-2.48,3.65-5.92,3.48-9.43-.24-4.8,1.94-9.69,6.54-12.72,4.68-3.08,11.03-2.99,15.64,.19,7.6,5.23,8.3,15.7,2.11,21.88Z'%20/%3e%3c/g%3e%3c/svg%3e)


Magic of Tooltips
Use a dynamic tooltip in Power BI to highlight your visuals, this has been a relatively recent update embedded into the Power BI suite.
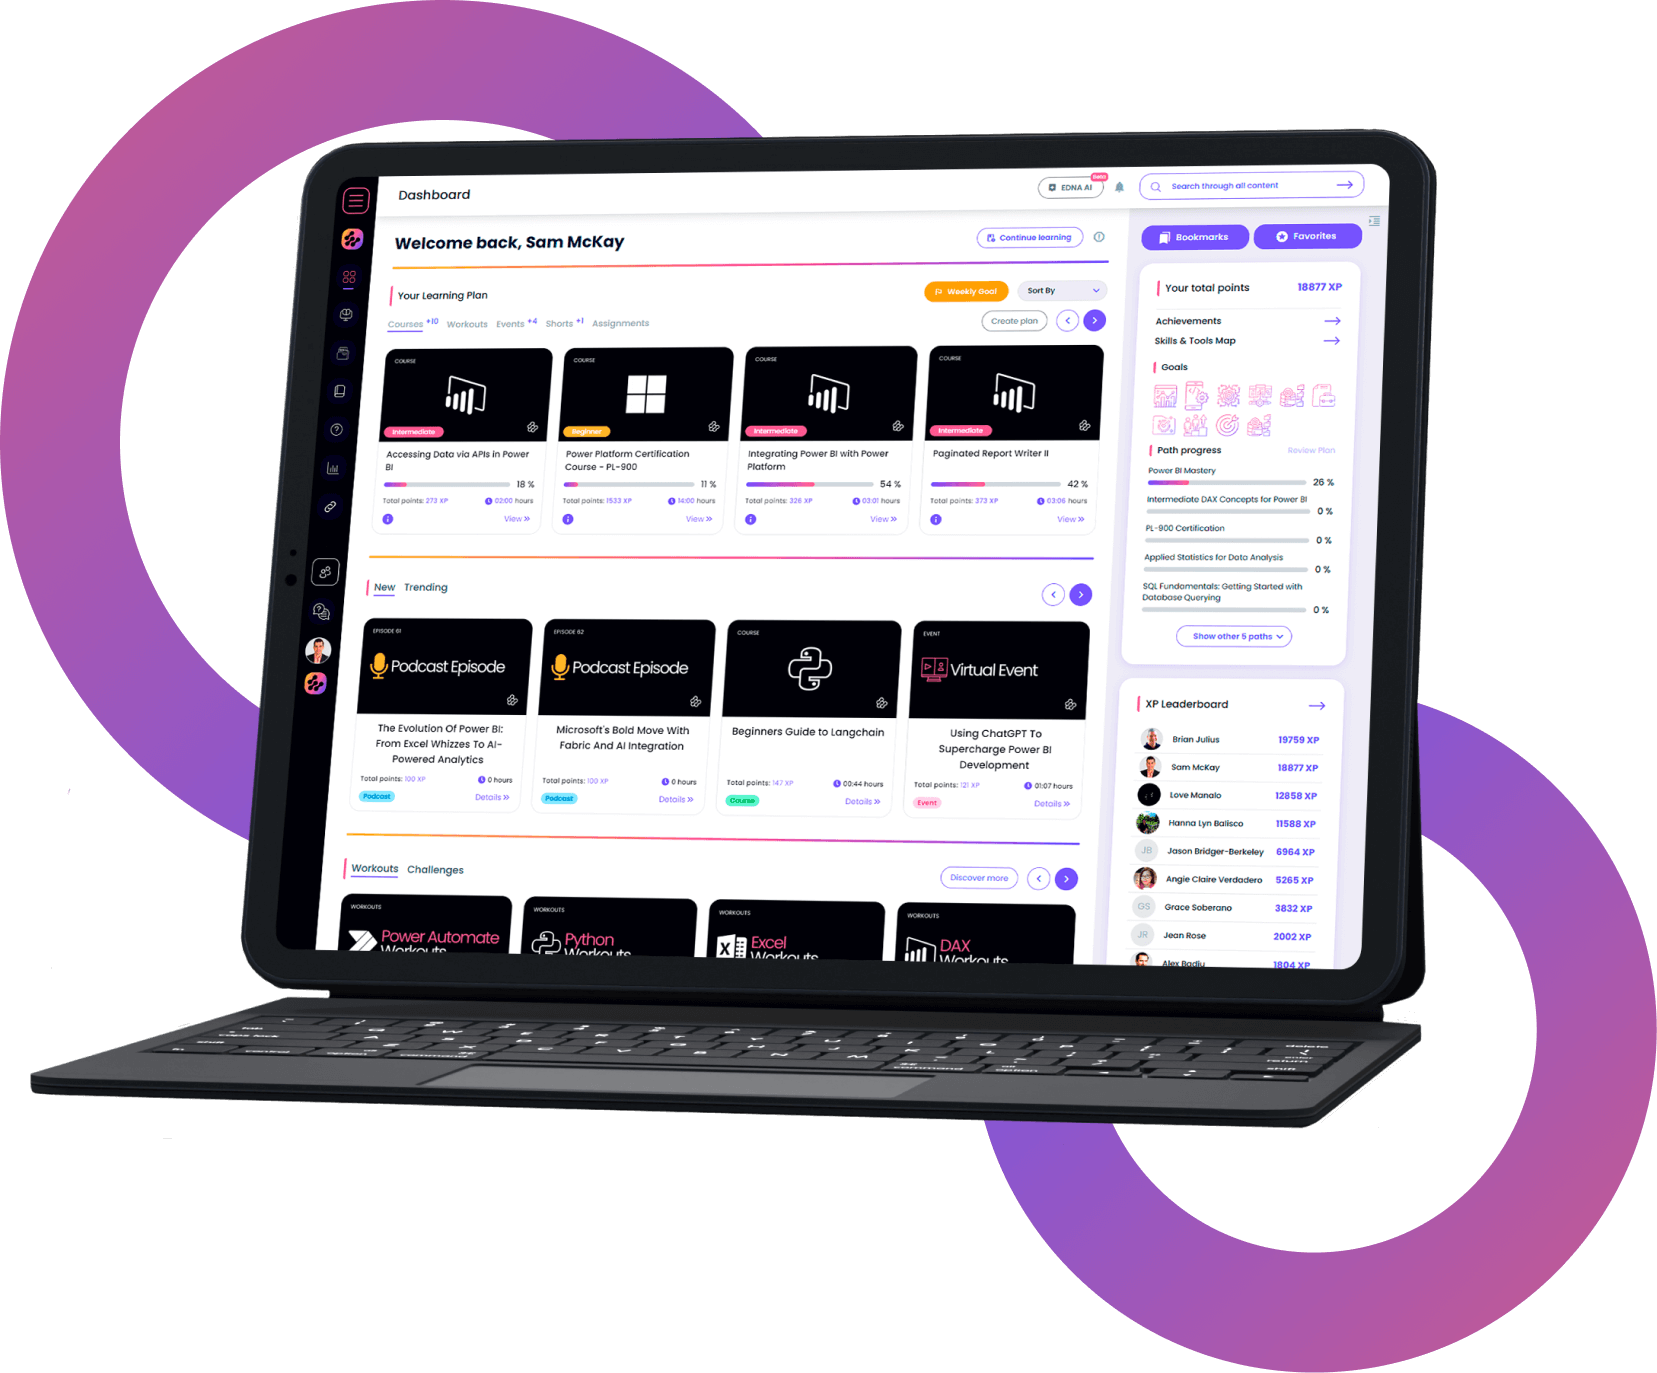
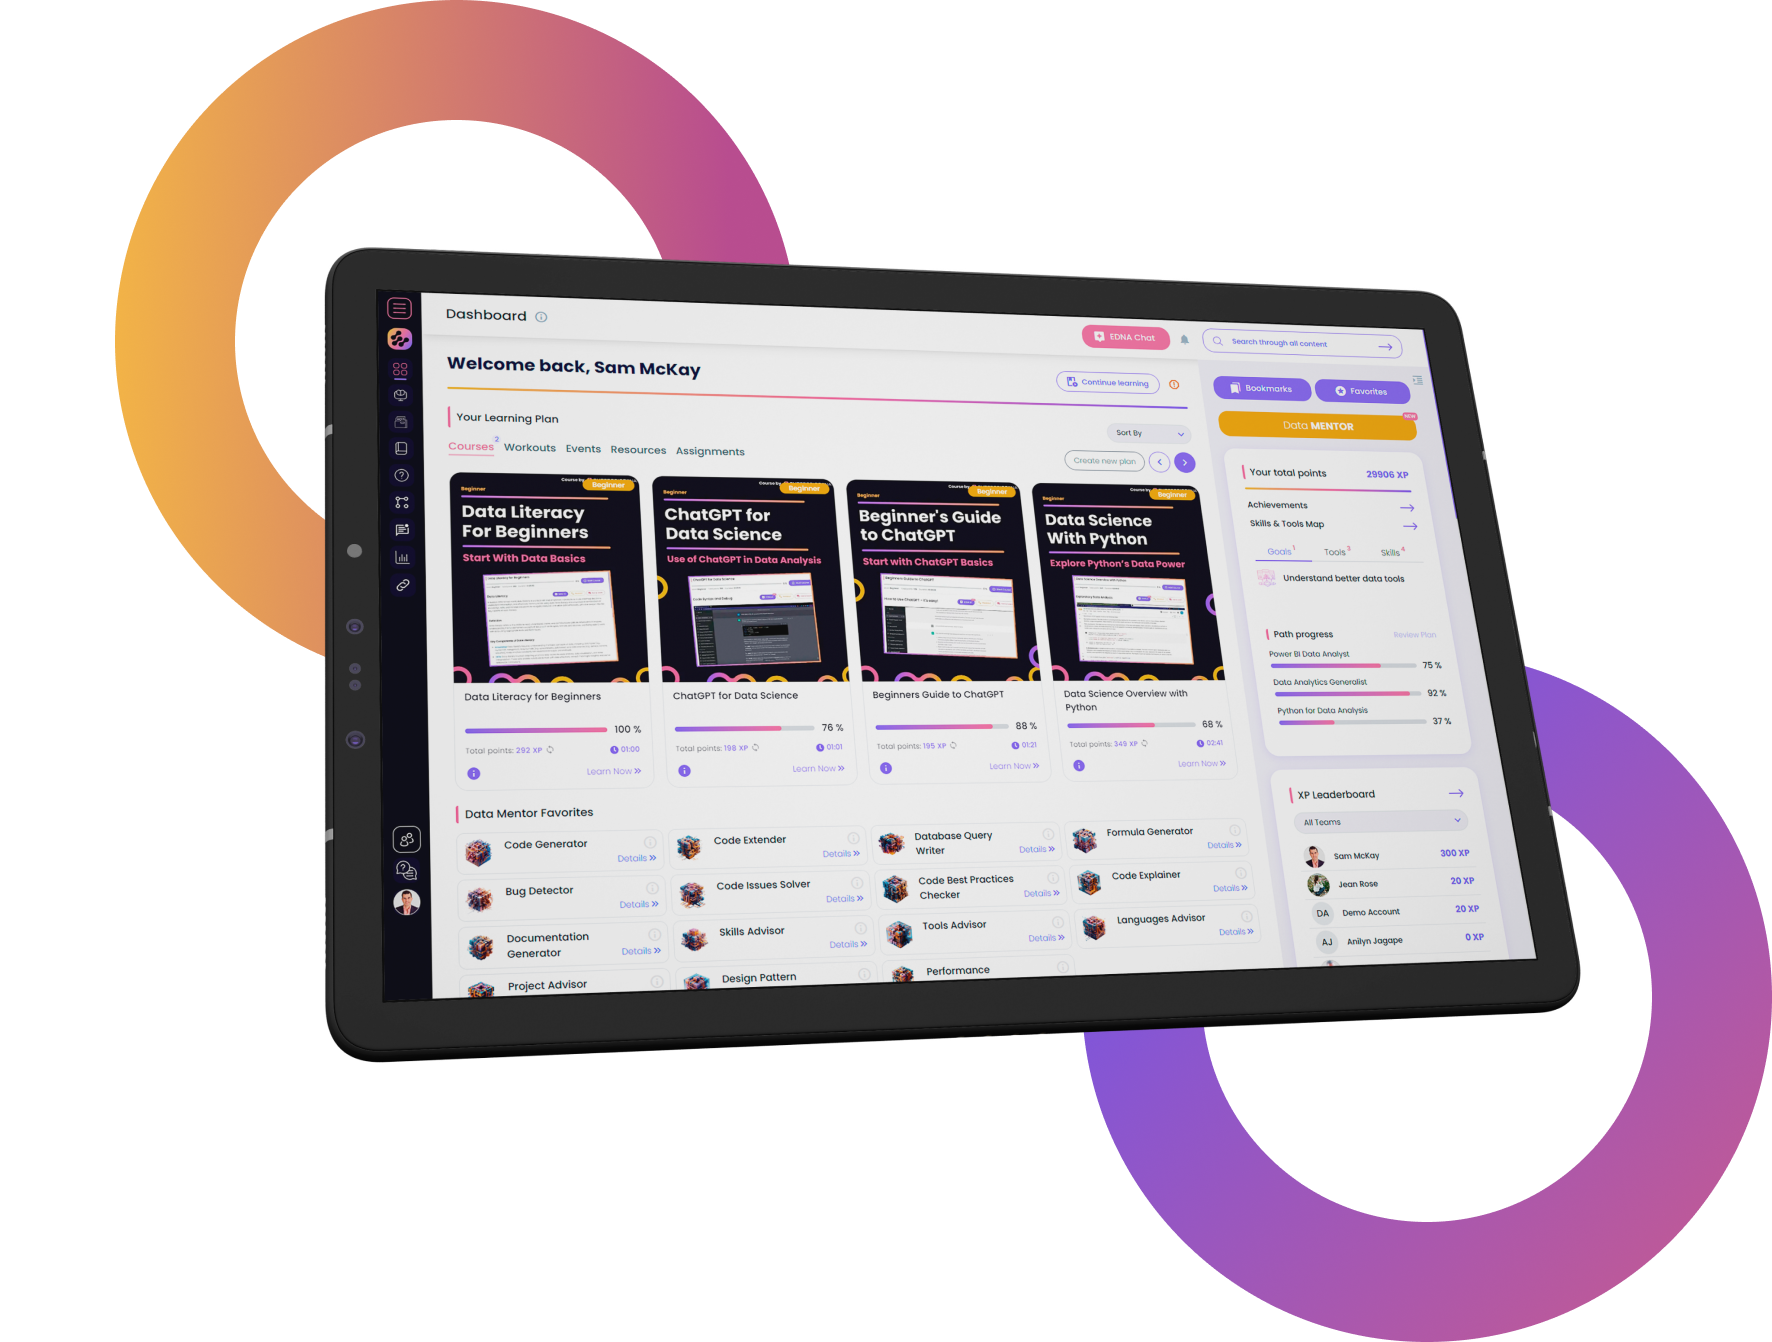
Trusted by 220,000+ people worldwide.
This visualization technique using the Power BI tooltip will keep your consumers engaged and it enables you to compact more information into a singular report page. You don’t need to build comprehensive reports with ten pages or more.his is a great visualization feature in Power BI. I recommend that you implement this technique in your own reports.
What our
Students Say
Curriculum
Creating A Dynamic Tooltip With Embedded Charts Using Power BI - Epic Data Viz. Tip
Creating A Visual Tooltip In Power BI - Make Your Consumers Really Go Wow
Placing Dynamic Maps In Tooltips In Power BI - Ultimate Data Viz Technique
How To Add Or Overlay Tooltips To Any Area Within A Power BI Report
Your
Instructor

Sam McKay
CEO & Founder
- Sam is Enterprise DNA's CEO & Founder. He helps individuals and organizations develop data-driven cultures and create enterprise value by delivering business intelligence training and education on Microsoft’s Power BI platform
- He partners with business decision-makers and analysts across all industries and business functions.
Frequently Asked
Questions
What’s the difference between a free account and a paid plan?
Do I need to know anything about data science or data analytics to get started with Enterprise DNA?
How will I be charged?
Can I get an invoice for my company?
Are refunds available?
Will AI take over the world and make data skills worthless?
Recommended
Courses

Integration, Analytics, and Governance for MS Fabric

Data Management and Processing in Microsoft Fabric
Foundations of Microsoft Fabric
Get full access to unparalleled
training & skill-building resources
FOR INDIVIDUALS
Enterprise DNA
For Individuals
Empowering the most valuable data analysts to expand their analytical thinking and insight generation possibilities.
Learn MoreFOR BUSINESS
Enterprise DNA
For Business
Training, tools, and guidance to unify and upskill the data analysts in your workplace.
Learn More