;%20}%20%3c/style%3e%3clinearGradient%20id='linear-gradient'%20x1='2.99'%20y1='29.35'%20x2='127.75'%20y2='101.39'%20gradientUnits='userSpaceOnUse'%3e%3cstop%20offset='0'%20stop-color='%23f2b347'%20/%3e%3cstop%20offset='.5'%20stop-color='%23ca5a8b'%20/%3e%3cstop%20offset='1'%20stop-color='%236654f5'%20/%3e%3c/linearGradient%3e%3c/defs%3e%3cg%20id='Layer_1-2'%20data-name='Layer%201'%3e%3cpath%20class='cls-1'%20d='M83.56,0H47.18C21.12,0,0,21.12,0,47.18v36.38c0,26.06,21.12,47.18,47.18,47.18h36.38c26.06,0,47.18-21.12,47.18-47.18V47.18C130.74,21.12,109.62,0,83.56,0ZM20.62,48.64c2.84-2.84,6.59-4.23,10.32-4.17,3.82,.07,7.55-1.1,10.25-3.8l.56-.56c2.7-2.7,3.86-6.43,3.8-10.25-.07-3.73,1.32-7.47,4.17-10.32,6.18-6.18,16.66-5.48,21.88,2.11,3.18,4.62,3.27,10.96,.19,15.64-3.02,4.6-7.92,6.78-12.72,6.54-3.51-.17-6.95,.99-9.43,3.48l-1.24,1.24c-2.48,2.48-3.65,5.92-3.48,9.43,.24,4.8-1.94,9.7-6.54,12.72-4.68,3.08-11.03,2.99-15.64-.19-7.6-5.23-8.29-15.7-2.11-21.88Zm33.7,34.25c-2.7,2.7-3.86,6.43-3.8,10.25,.07,3.73-1.32,7.47-4.17,10.32-6.18,6.18-16.66,5.48-21.88-2.11-3.18-4.62-3.27-10.96-.19-15.64,3.02-4.6,7.92-6.78,12.72-6.54,3.51,.17,6.94-.99,9.43-3.48l1.24-1.24c2.48-2.48,3.65-5.92,3.48-9.43-.24-4.8,1.94-9.7,6.54-12.72,4.68-3.08,11.03-2.99,15.64,.19,7.6,5.23,8.3,15.7,2.11,21.88-2.84,2.84-6.59,4.23-10.32,4.17-3.82-.07-7.55,1.1-10.25,3.8l-.56,.56Zm55.8-2.93c-2.96,2.96-6.91,4.35-10.79,4.15-3.51-.17-6.96,.99-9.44,3.48l-1.23,1.23c-2.49,2.49-3.65,5.93-3.48,9.44,.19,3.88-1.19,7.82-4.15,10.79-6.18,6.18-16.66,5.48-21.88-2.11-3.18-4.62-3.27-10.96-.19-15.64,3.02-4.6,7.92-6.78,12.72-6.54,3.51,.17,6.95-.99,9.43-3.48l1.24-1.24c2.48-2.48,3.65-5.92,3.48-9.43-.24-4.8,1.94-9.69,6.54-12.72,4.68-3.08,11.03-2.99,15.64,.19,7.6,5.23,8.3,15.7,2.11,21.88Z'%20/%3e%3c/g%3e%3c/svg%3e)


Enterprise DNA Skills
Report Design
Create visually appealing and informative reports that effectively communicate data-driven insights to stakeholders.
Start Learning for Free
New to Report Design?
Start here.

Paid Course
Power BI Super Users Workshop
An in depth overview of the entire Power BI suite, with a focus on using Power BI to extract compelling insights from your own data.
Learning
Paths
Path

Mastering Visualization with Power BI
Gain comprehensive knowledge in key features including data transformation, modeling, DAX calculations, and visualization. Build analytical solutions surpassing traditional reporting!
Intermediate
10 Hours
Path

Data Analytics Generalist
Gain a versatile skill set covering a wide range of data analysis techniques and tools, preparing you for diverse roles in the dynamic field of data analytics!
Beginner
17 Hours
Path

Power BI Data Analyst
Master the skills needed to ace the PL-300 certification exam, blending foundational Power BI knowledge with advanced DAX techniques.
Beginner
19 Hours
Path

Power BI & Python for Advanced Analytics
Dive deep into machine learning with Python, mastering predictive analytics and advanced data manipulations to excel in complex analytical tasks.
Advanced
7 Hours
Learning
Center
Course
Power BI Super Users Workshop
An in depth overview of the entire Power BI suite, with a focus on using Power BI to extract compelling insights from your own data.
Beginner
9 Hours
Course

Technical Guide to Transitioning from Power BI to Paginated Reports
Master the art of pulling data from Power BI into Paginated Reports with our expert-led course. Gain invaluable technical skills and unlock new reporting capabilities!
Intermediate
2 Hours
Course

Financial Reporting With Power BI
Create comprehensive financial reports in Power BI that represent key insights in a compelling and dynamic way
Advanced
6 Hours
Course

Dashboarding & Data Visualization Intensive
Learn how to develop complete Power BI solutions that look compelling and deeply engage your consumers in your insights
Advanced
7 Hours
Course

Unlock Analytical Insights with Geospatial Mastery in Power BI
Disclose the unexpected' by expertly incorporating geospatial data into your analyses and visualizations
Intermediate
1 Hours
Course

Complete Guide to Report Development from Start to Finish
A detailed step-by-step process of creating high-quality Power BI reports that satisfy the requirements of real-world scenarios
Intermediate
3 Hours
Course

Machine Learning Models in Power BI
Master predictive analytics in Power BI: Learn preprocessing to advanced AutoML. Unlock powerful machine learning models and transform your data.
Intermediate
1 Hours
Course

Mastering Paginated Reports with Diverse Report
Master report creation in Paginated Report Builder and unleash your data storytelling skills. Learn to craft diverse report types with precision and impact!
Intermediate
3 Hours
Virtual
Events
Podcast

What Could Self Service BI Look Like?
Self-service BI had potential, but never truly worked. This podcast episode explores why and what it could look like today with smarter tools.
Project
Center
Challenge

OEE Manufacturing Report
Work on one of the most significant measures for manufacturing productivity - OEE
Challenge

Mobile Phone Sales Dataset
Explore 2024 mobile phone sales data to uncover product trends, customer insights, and regional performance to support smarter business decisions.
Challenge

Hotels Revenue Management
Take on the challenge of creating an analysis report on hotels revenue management data.
Challenge

Covid 19 Reporting
An excellent opportunity for you to create a one-page data report for Covid-19 analysis
Challenge
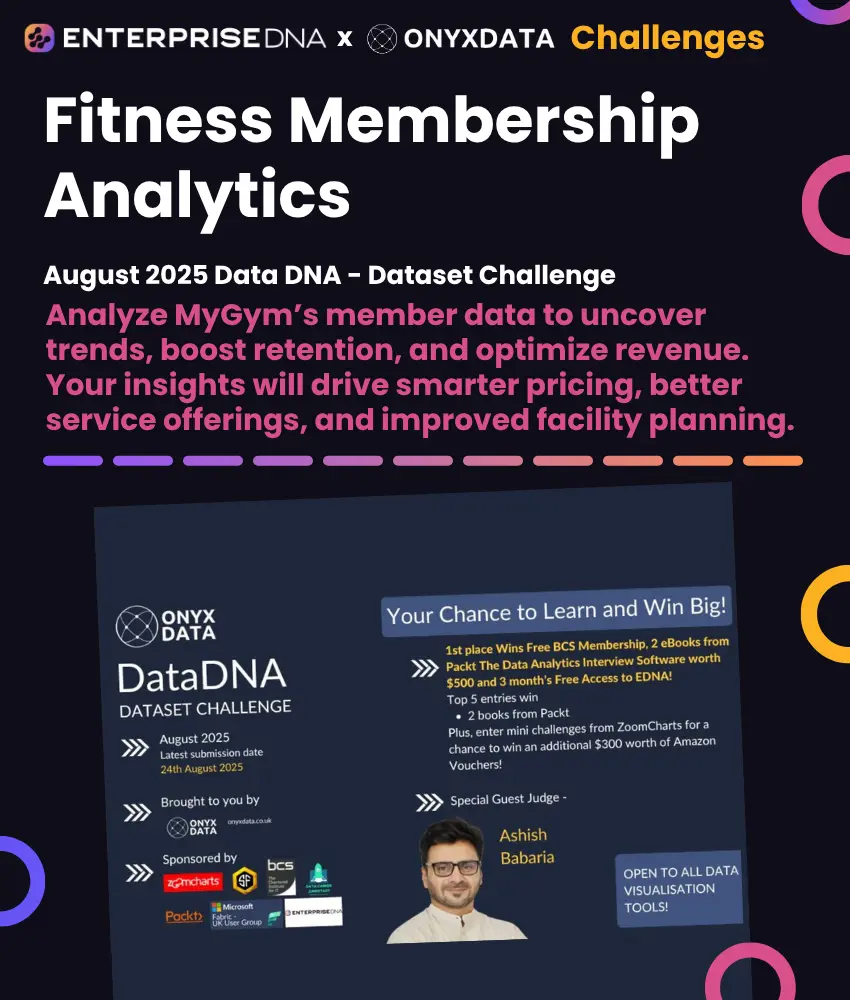
Fitness Membership Analytics
Analyze MyGym’s member data to uncover trends, boost retention, and optimize revenue. Your insights will drive smarter pricing, better service offerings, and improved facility planning.
Challenge

Social Media Content Performance
Analyze 2024 social media data to uncover what makes content perform across platforms. Show your insights, sharpen your skills, and compete for exciting prizes.
Challenge

Purchases, Inventory And Sales
Practice your data skills and learn from what is a typical scenario faced by many businesses in various industries
Challenge

Sales and Production Analysis
Implement your analytical skills in creating a report of the entire business operation from production to forecasting.
Guides
Resource

Power BI Data Storytelling
Master visual storytelling techniques to deliver data narratives that engage and inform, making your reports more effective and memorable!
Resource

40 Ways to Optimize Your Power BI Report Today
Boost your Power BI report's performance and clarity with 40 actionable tips you can apply right now.
Resource

Geospatial Mastery in Power BI
Learn advanced techniques for mapping, resource allocation, and data visualization to support strategic business decisions!
Resource

Master Paginated Reports
Learn to use Report Builder for creating detailed, print-ready reports to optimize performance and security!
Resource

Dashboarding & Data Visualization
Learn essential design principles, advanced DAX, and dynamic interactivity to create visually appealing and functional dashboards!
Resource

Report Development
Learn to optimize report performance, implement new Power BI features, and organize measures effectively!
Resource

Beginner Steps To Learning Power BI
This guide provides a step-by-step approach for beginners to effectively learn and master Power BI, focusing on key concepts, data handling, and report creation.
Resource

Template First Thinking for 3× Faster Dashboards
Build dashboards 3× faster with pre-built templates, branded backgrounds, and AI automation to save time and deliver insights instantly.