;%20}%20%3c/style%3e%3clinearGradient%20id='linear-gradient'%20x1='2.99'%20y1='29.35'%20x2='127.75'%20y2='101.39'%20gradientUnits='userSpaceOnUse'%3e%3cstop%20offset='0'%20stop-color='%23f2b347'%20/%3e%3cstop%20offset='.5'%20stop-color='%23ca5a8b'%20/%3e%3cstop%20offset='1'%20stop-color='%236654f5'%20/%3e%3c/linearGradient%3e%3c/defs%3e%3cg%20id='Layer_1-2'%20data-name='Layer%201'%3e%3cpath%20class='cls-1'%20d='M83.56,0H47.18C21.12,0,0,21.12,0,47.18v36.38c0,26.06,21.12,47.18,47.18,47.18h36.38c26.06,0,47.18-21.12,47.18-47.18V47.18C130.74,21.12,109.62,0,83.56,0ZM20.62,48.64c2.84-2.84,6.59-4.23,10.32-4.17,3.82,.07,7.55-1.1,10.25-3.8l.56-.56c2.7-2.7,3.86-6.43,3.8-10.25-.07-3.73,1.32-7.47,4.17-10.32,6.18-6.18,16.66-5.48,21.88,2.11,3.18,4.62,3.27,10.96,.19,15.64-3.02,4.6-7.92,6.78-12.72,6.54-3.51-.17-6.95,.99-9.43,3.48l-1.24,1.24c-2.48,2.48-3.65,5.92-3.48,9.43,.24,4.8-1.94,9.7-6.54,12.72-4.68,3.08-11.03,2.99-15.64-.19-7.6-5.23-8.29-15.7-2.11-21.88Zm33.7,34.25c-2.7,2.7-3.86,6.43-3.8,10.25,.07,3.73-1.32,7.47-4.17,10.32-6.18,6.18-16.66,5.48-21.88-2.11-3.18-4.62-3.27-10.96-.19-15.64,3.02-4.6,7.92-6.78,12.72-6.54,3.51,.17,6.94-.99,9.43-3.48l1.24-1.24c2.48-2.48,3.65-5.92,3.48-9.43-.24-4.8,1.94-9.7,6.54-12.72,4.68-3.08,11.03-2.99,15.64,.19,7.6,5.23,8.3,15.7,2.11,21.88-2.84,2.84-6.59,4.23-10.32,4.17-3.82-.07-7.55,1.1-10.25,3.8l-.56,.56Zm55.8-2.93c-2.96,2.96-6.91,4.35-10.79,4.15-3.51-.17-6.96,.99-9.44,3.48l-1.23,1.23c-2.49,2.49-3.65,5.93-3.48,9.44,.19,3.88-1.19,7.82-4.15,10.79-6.18,6.18-16.66,5.48-21.88-2.11-3.18-4.62-3.27-10.96-.19-15.64,3.02-4.6,7.92-6.78,12.72-6.54,3.51,.17,6.95-.99,9.43-3.48l1.24-1.24c2.48-2.48,3.65-5.92,3.48-9.43-.24-4.8,1.94-9.69,6.54-12.72,4.68-3.08,11.03-2.99,15.64,.19,7.6,5.23,8.3,15.7,2.11,21.88Z'%20/%3e%3c/g%3e%3c/svg%3e)


Enterprise DNA Skills
Data Analysis
Apply statistical and analytical techniques to raw data to uncover insights and make informed decisions.
Start Learning for Free
New to Data Analysis?
Start here.

Paid Course
Beginners Guide to R for Data Analysis
This course introduces beginners to the R programming language, focusing on its application in data analysis.
Learning
Paths
Path

Data Analytics Generalist
Gain a versatile skill set covering a wide range of data analysis techniques and tools, preparing you for diverse roles in the dynamic field of data analytics!
Beginner
17 Hours
Path

DAX for Power BI Analysis
Master the most in-depth and rigorous path on Power BI, gaining expert-level skills across all key pillars of analysis.
Intermediate
24 Hours
Path

Querying & SQL Fundamentals
Gain a thorough understanding of SQL fundamentals for seamless data manipulation and querying, setting the foundation for advanced database management.
Intermediate
6 Hours
Path

Power BI for Data Science
Discover data cleaning, data frames, and essential packages like dplyr, tidyverse, skim R, and seaborn for powerful data visualization.
Intermediate
18 Hours
Path

Power BI Data Analyst
Master the skills needed to ace the PL-300 certification exam, blending foundational Power BI knowledge with advanced DAX techniques.
Beginner
19 Hours
Path

Python for Data Analysis
Take your data analysis to the next level with Python. Seamlessly integrate Python and AI for efficient workflows and game-changing insights.
Beginner
12 Hours
Path

Mastering Visualization with Power BI
Gain comprehensive knowledge in key features including data transformation, modeling, DAX calculations, and visualization. Build analytical solutions surpassing traditional reporting!
Intermediate
10 Hours
Path

M Code for Power Query
Master the art of creating visually appealing and insightful dashboards and reports using Power BI, leveraging its wide range of visualization options and features.
Intermediate
11 Hours
Learning
Center
Course
Beginners Guide to R for Data Analysis
This course introduces beginners to the R programming language, focusing on its application in data analysis.
Beginner
3 Hours
Course

Scenario Analysis Deep Dive
Learn how to predict and optimize for results in the future, by utilizing 'what if' parameters and scenario analysis techniques
Intermediate
3 Hours
Course

Power Platform Certification Course - PL-900
Dominate the Microsoft Power Platform (PL-900) Certification exam with our comprehensive training guide. Gain the knowledge and confidence to excel!
Beginner
14 Hours
Course

Beginners Guide to Power BI
Kickstart your journey with our specialized training! Turn raw data into stunning visuals and master Power BI essentials through interactive lessons. Begin your path to data expertise!
Beginner
2 Hours
Course
Advanced Visualization and Text Analysis with R in Power BI
Enhance your Power BI reports and analysis with R's visualization, text analysis and statistical modeling capabilities.
Intermediate
3 Hours
Course

Power BI Super Users Workshop
An in depth overview of the entire Power BI suite, with a focus on using Power BI to extract compelling insights from your own data.
Beginner
9 Hours
Course

Python for Marketing Analytics
Elevate your marketing capabilities by integrating Python's robust analytical and data visualization tools, enhancing marketing strategies with insights powered by Python.
Intermediate
1 Hours
Course

Navigating Financial Data with Python
Elevate your financial analytics skills with Python for Finance, exploring cutting-edge techniques for data retrieval, time series analysis, and predictive modeling.
Intermediate
1 Hours
Virtual
Events
Podcast

The Analyst Role Has Changed, Here’s How to Win
Resumes don’t cut it anymore. Showcase your work, build real projects, and focus on strategy to future-proof your career.
Podcast

The Potential of Vibe Coding, MCP, and Tool Use With AI
Vibe coding, Model Context Protocol (MCP), and AI-powered tool use represent a transformative shift in how developers interact with technology. These innovations bridge the gap between learning and implementation, enhance productivity, and redefine how we work with AI—making development more intuitive, accessible, and dynamic.
Podcast

Is Copilot Finally on Track & New AI Innovations Coming Out Soon
Is Copilot finally finding its stride? With new AI innovations on the horizon, the way we work might be about to change—again. Are we prepared for what’s coming, or just getting comfortable with the current wave? The future isn’t slowing down.
Podcast

AI Is Moving Fast, But It Still Needs You!
AI is fast. But it still needs you. This episode unpacks why orchestration matters more than ever.
Podcast

Real World MCP Applications & AI Learning
Model Context Protocol (MCP) is transforming how AI tools operate in real-world settings. By improving the way context is carried and recalled, MCP unlocks smarter automation and learning. As AI systems evolve, MCP will play a key role in how we bridge learning, memory, and adaptive functionality across tools and workflows.
Podcast

The AI Revolution: How Automation, APIs, & No-Code Tools Are Changing Everything
This conversation explores the transformative power of AI-driven tools in development, data analytics, and automation, highlighting how new technologies are reshaping workflows and unlocking new opportunities.
Podcast

Who Wins and Who Loses Early in the AI Era
We’re no longer asking if AI will change the world—it already has. The real question now? Who’s actually winning—and who’s quietly being left behind.
Podcast

From Power BI to AI and How Tech Is Rewriting the Rules of Development with Brian Julius
In this video, we dive deep into how advancements in artificial intelligence are transforming the software development landscape. From Power BI integrations to the rise of AI coding assistants like OpenRouter and the adoption of Vibe Coding, discover how developers are rethinking traditional workflows.
Project
Center
Challenge

Currency Conversion and More
Challenge your data skills by producing a report that gives the user the ability to select a currency and see the
associated sales and cost
Challenge

The Pursuit of Happiness
In this challenge, participants are encouraged to dive deep, explore, and come up with unique insights and visualizations.
Challenge

Sport - Football/Soccer Players Summer Transfers Season 2022-23
Develop an analysis report about the Football/Soccer Players Summer Transfers Season 2022-23
Challenge
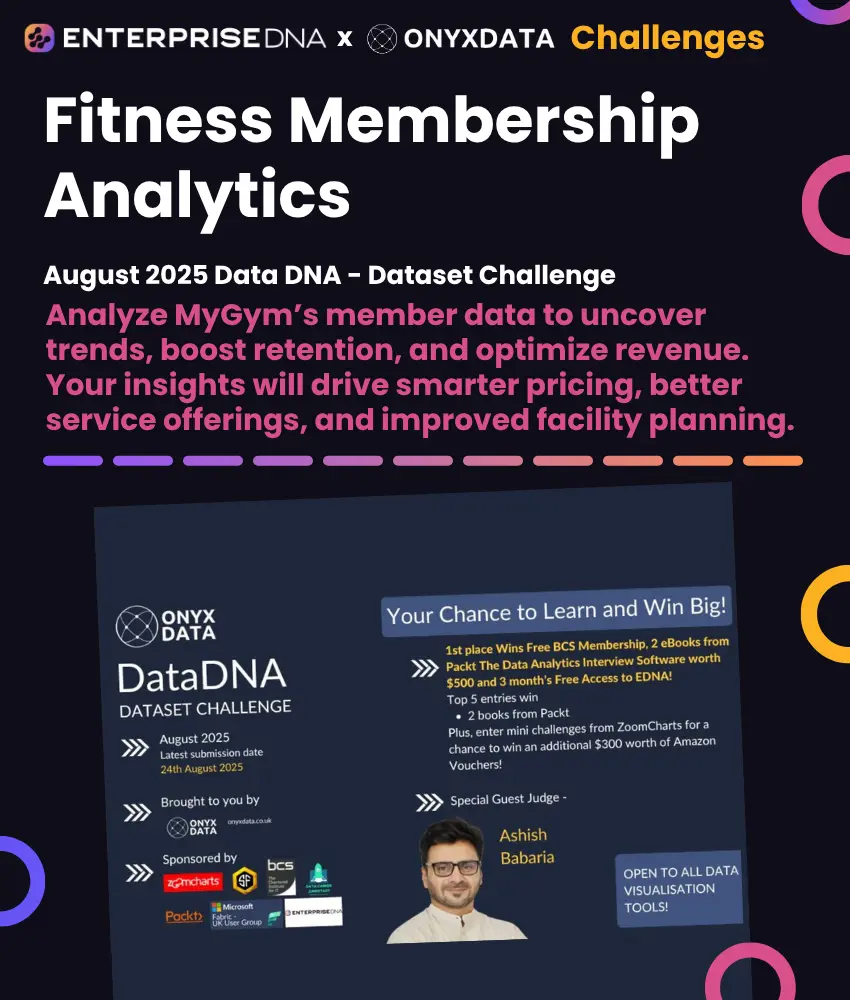
Fitness Membership Analytics
Analyze MyGym’s member data to uncover trends, boost retention, and optimize revenue. Your insights will drive smarter pricing, better service offerings, and improved facility planning.
Challenge

OEE Manufacturing Report
Work on one of the most significant measures for manufacturing productivity - OEE
Challenge

Insurance Complaints
Analyze the data of a large insurance company who are due to undergo an internal audit with regard to its complaint’s procedure
Challenge

Healthcare Analysis Dataset
Showcase your data analytical and visualization skills by transforming complex healthcare records into actionable insights that can revolutionize patient care and drive cost efficiencies.
Challenge

Hotels Revenue Management
Take on the challenge of creating an analysis report on hotels revenue management data.
Guides
Dataset

Customer Segmentation Data
This dataset provides insights into customer behavior and preferences through a loyalty program. The data includes details on customer demographics, purchase history, and feedback.
Resource

Balancing Creativity With Efficiency
Balance creativity with efficiency by using AI to capture ideas, organize workflows, and automate repetitive tasks, enabling faster execution while preserving creative freedom.
Resource

Big Data with Pandas, Polars & PySpark
Learn to handle vast datasets, perform complex data transformations, and optimize your big data analytics workflow efficiently!
Resource

Debugging Complex DAX Formula
Discover how to simplify your debugging by breaking formulas apart, using variables, and testing each component.
Resource

Optimizing Dax
Learn to enhance DAX performance through effective query planning, VertiPaq optimization, and strategic query analysis!
Resource

Practical Guide to SQL Queries
Master the art of creating and optimizing SQL queries to enhance your data analysis capabilities.
Resource

Python Marketing Analytics
Learn to utilize Python for robust marketing analytics, from data manipulation to predictive modeling.
Resource

How To Become The Most High-Value Data Person In Your Organization
This infographic offers a clear and straightforward guide to enhancing your role in your organization through data skills.