Enterprise DNA Skills
Data Strategy
Define an organization's overall approach to managing, analyzing, and leveraging data to drive value and achieve strategic goals.
Start Learning for Free
New to Data Strategy?
Start here.

Paid Course
SharePoint Integration With Power Platform
Transform and automate business processes by integrating SharePoint with Power Automate and Power Apps to build workflows and customized forms
Learning
Paths
Path

Data Analytics Generalist
Gain a versatile skill set covering a wide range of data analysis techniques and tools, preparing you for diverse roles in the dynamic field of data analytics!
Beginner
17 Hours
Path

Mastering Visualization with Power BI
Gain comprehensive knowledge in key features including data transformation, modeling, DAX calculations, and visualization. Build analytical solutions surpassing traditional reporting!
Intermediate
10 Hours
Path

Python for Data Analysis
Take your data analysis to the next level with Python. Seamlessly integrate Python and AI for efficient workflows and game-changing insights.
Beginner
12 Hours
Path

DAX for Power BI Analysis
Master the most in-depth and rigorous path on Power BI, gaining expert-level skills across all key pillars of analysis.
Intermediate
24 Hours
Path

No-Code Automation with Power Automate
Explore into built-in connectors, mastering basic flows to advanced error handling for seamless workflow efficiency.
Advanced
9 Hours
Path

Microsoft Fabric Fundamentals
Elevate your expertise in data management, analytics, and system integration. Start your transformative journey with our comprehensive courses!
Intermediate
11 Hours
Learning
Center
Course

SharePoint Integration With Power Platform
Transform and automate business processes by integrating SharePoint with Power Automate and Power Apps to build workflows and customized forms
Intermediate
4 Hours
Course

Data Analysis with PandasAI
Unlock the power of data analysis and visualization with PandasAI, and transform raw data into actionable insights that drive decision-making and growth.
Intermediate
1 Hours
Course

SharePoint Introduction For Power BI Users
Learn the basics of SharePoint to increase productivity and collaboration, organize your data, and automate business processes
Beginner
6 Hours
Course

Advanced SharePoint Concepts Lists Permissions and Social Features
Streamline your data storage and sharing through advanced concepts on SharePoint List, Permissions and Social
Advanced
6 Hours
Course

Integration, Analytics, and Governance for MS Fabric
Advance your data strategy with Microsoft Fabric and Azure. Discover how to optimize workspaces, develop effective pipelines, and manage data flows for enhanced security and governance.
Intermediate
6 Hours
Course

Declarative Visualization Techniques in Power BI with Deneb
Unlock limitless visualization possibilities with Vega languages. Master custom graphic creation and elevate your data storytelling like never before!
Intermediate
2 Hours
Assessment

Microsoft Fabric Fundamentals
Test your Microsoft Fabric skills in data management and analytics to earn a specialized certification.
Intermediate
Assessment

Data Analytics Generalist
Validate your skills in managing and enhancing data processes with AI, focusing on creating dynamic, insightful reports.
Beginner
Virtual
Events
Podcast

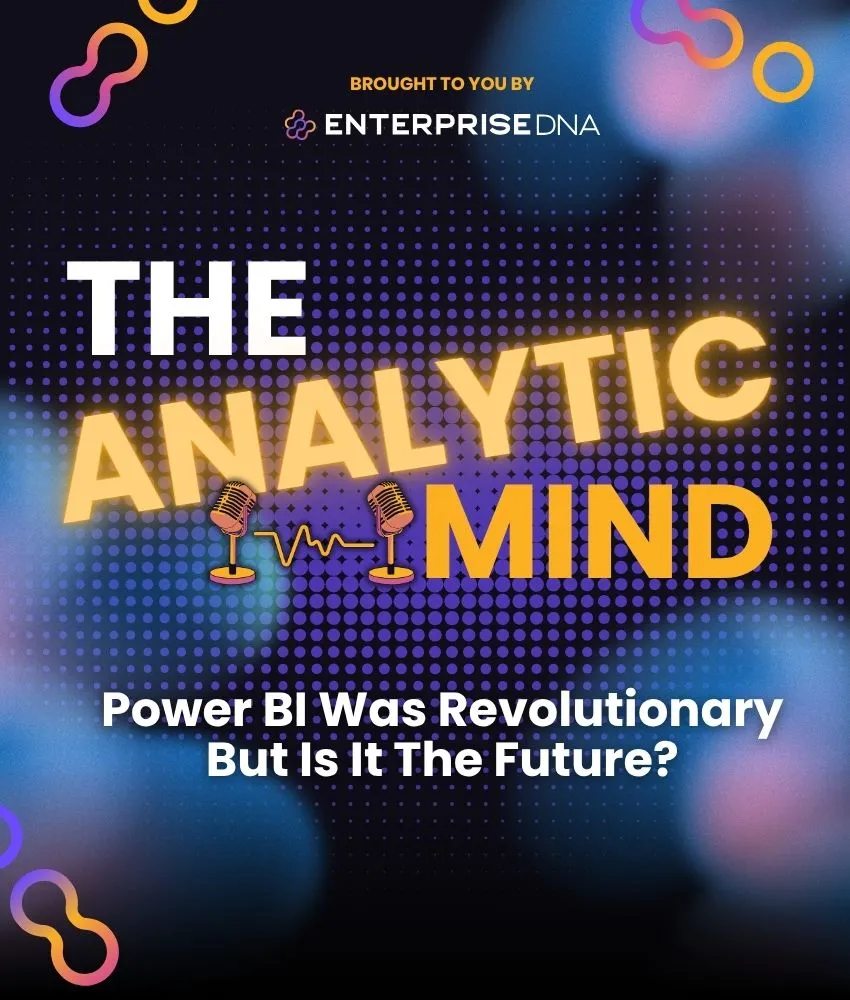
Power BI Was Revolutionary But Is It The Future?
Power BI transformed analytics, but as AI reshapes the landscape, is it still the tool for the future? This episode explores what's next for data professionals.
Virtual Event

Calculation Groups Beyond Time Intelligence
Dynamic data labels at the end of the line
00:46:11 Hours
Virtual Event

Building Data Agents Part 1
Learn how to structure your AI data app using tools like Lovable and Supabase—starting with just a CSV file.
Beginner
01:14:09 Hours
Virtual Event

Explore Joins In DAX With/Without Relationships
Explore how to combine data from different tables with or without a relationship in DAX
00:41:00 Hours
Virtual Event

Innovations In Power BI & Power Platform Summit
Learn what it takes to develop high quality Power BI & Power Platform reports
19:37:28 Hours
Virtual Event

DAX Counterculture: Alternative Prospectives On DAX
Know the techniques in creating indexes and how to loop efficiently using DAX
00:42:41 Hours
Virtual Event

Collection Of Custom Visuals & Niche Techniques In Power BI
Create powerful and informative data visualizations with Key Performance Indicators and formatting with calculation groups
00:52:34 Hours
Virtual Event

CALCULATE Deep Dive
Understand the difference between table functions and CALCULATE modifiers and how to use them correctly
01:03:56 Hours
Project
Center
Challenge

Transport and Shipping Data
Challenge your data skills by creating a report on transport and shipping data
Challenge

Time Intelligence - Highlighting Trends
Showcase a report that compares the trends of two different sets of data over time. The report will specifically highlight any divergences in the trends, allowing the reader to easily see any discrepancies in the data.
Challenge

Environmental Data Reporting
Create an analysis report on environmental data and potentially impact how this data is visualized and recorded
Challenge

Twitter Threads Analysis
Jump into this twitter related dataset and showcase some interesting insights based on the text of the tweet and the stock reference or tagged within the tweet itself.
Challenge

Social Media Content Performance
Analyze 2024 social media data to uncover what makes content perform across platforms. Show your insights, sharpen your skills, and compete for exciting prizes.
Challenge

Global Cost Of Living Crisis
Identify trends and patterns in a variety of factors that influence the cost of living in different regions around the world by using statistical analysis techniques and visualization tools.
Challenge

HR Data Insights
Challenge yourself to produce a report which gives HR insight into the consultation process.
Challenge

Financial Report Showcase
Show off your impressive financial report! We are confident that your financial report is a testament to your skills and expertise. We would love to see how you've structured it and how you've made it visually appealing.
Guides
Resource

Data Integration vs Data Federation
Explore Data Integration’s centralized data consolidation vs. Data Federation's virtualized access for real-time queries. Download to master the best data strategy for your needs!
Resource

Data Governance vs Data Management
Data Governance ensures data integrity with policies, while Data Management focuses on data accessibility using tech tools. Both are crucial for data quality!
Resource

Excel, Power BI, Python and AI in One Powerful Flow
Combine Excel, Power BI, Python, and AI to automate your data tasks, speed up reporting, and unlock smarter, seamless insights, all in one powerful workflow.
Resource

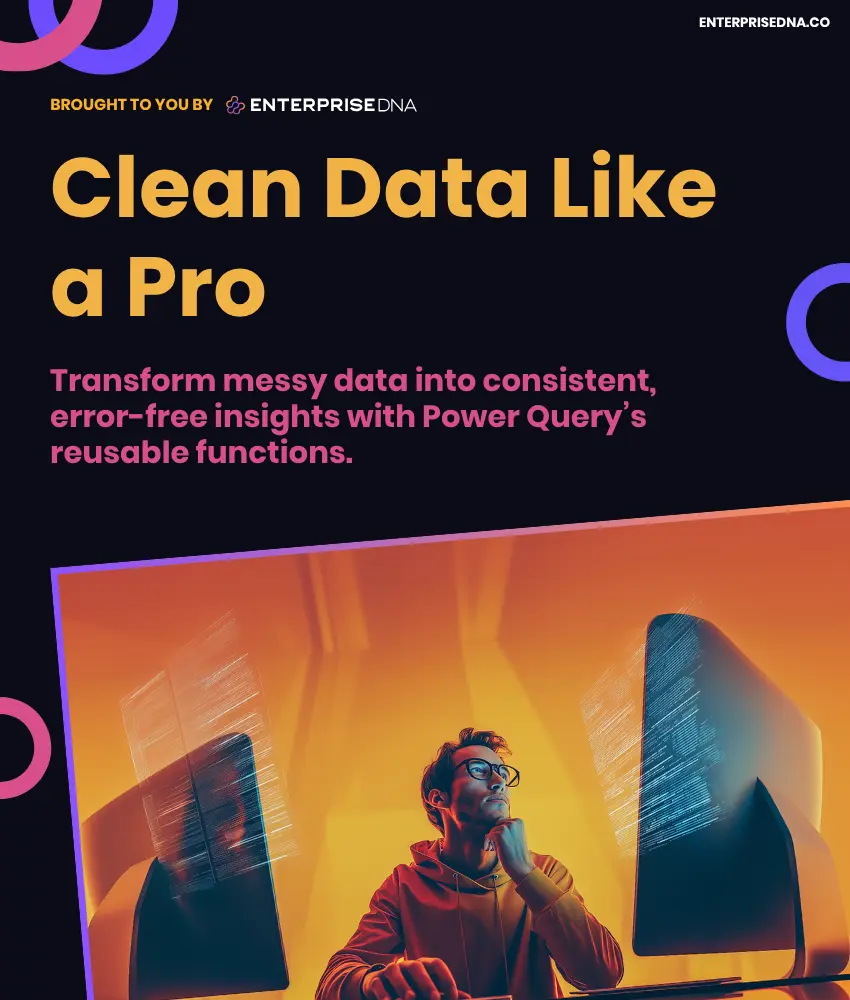
Clean Data Like a Pro
Transform messy data into consistent, error-free insights with Power Query’s reusable functions.
Resource

SharePoint & Power Platform
Harness Power Apps and Power Automate to enhance SharePoint's capabilities, creating robust, automated solutions that drive business success!
Resource

Advanced SharePoint Tools
Learn to expertly manage lists, set precise permissions, and utilize social features to enhance collaboration and security!
Resource

Batch Processing vs Real-Time Processing
Batch processes large data sets periodically, while real-time gives you insights on the spot. Find out which is right for you!
Resource

Better Results with Prompt Libraries
Boost your AI results with organized, reusable prompts for smarter, faster answers.


