;%20}%20%3c/style%3e%3clinearGradient%20id='linear-gradient'%20x1='2.99'%20y1='29.35'%20x2='127.75'%20y2='101.39'%20gradientUnits='userSpaceOnUse'%3e%3cstop%20offset='0'%20stop-color='%23f2b347'%20/%3e%3cstop%20offset='.5'%20stop-color='%23ca5a8b'%20/%3e%3cstop%20offset='1'%20stop-color='%236654f5'%20/%3e%3c/linearGradient%3e%3c/defs%3e%3cg%20id='Layer_1-2'%20data-name='Layer%201'%3e%3cpath%20class='cls-1'%20d='M83.56,0H47.18C21.12,0,0,21.12,0,47.18v36.38c0,26.06,21.12,47.18,47.18,47.18h36.38c26.06,0,47.18-21.12,47.18-47.18V47.18C130.74,21.12,109.62,0,83.56,0ZM20.62,48.64c2.84-2.84,6.59-4.23,10.32-4.17,3.82,.07,7.55-1.1,10.25-3.8l.56-.56c2.7-2.7,3.86-6.43,3.8-10.25-.07-3.73,1.32-7.47,4.17-10.32,6.18-6.18,16.66-5.48,21.88,2.11,3.18,4.62,3.27,10.96,.19,15.64-3.02,4.6-7.92,6.78-12.72,6.54-3.51-.17-6.95,.99-9.43,3.48l-1.24,1.24c-2.48,2.48-3.65,5.92-3.48,9.43,.24,4.8-1.94,9.7-6.54,12.72-4.68,3.08-11.03,2.99-15.64-.19-7.6-5.23-8.29-15.7-2.11-21.88Zm33.7,34.25c-2.7,2.7-3.86,6.43-3.8,10.25,.07,3.73-1.32,7.47-4.17,10.32-6.18,6.18-16.66,5.48-21.88-2.11-3.18-4.62-3.27-10.96-.19-15.64,3.02-4.6,7.92-6.78,12.72-6.54,3.51,.17,6.94-.99,9.43-3.48l1.24-1.24c2.48-2.48,3.65-5.92,3.48-9.43-.24-4.8,1.94-9.7,6.54-12.72,4.68-3.08,11.03-2.99,15.64,.19,7.6,5.23,8.3,15.7,2.11,21.88-2.84,2.84-6.59,4.23-10.32,4.17-3.82-.07-7.55,1.1-10.25,3.8l-.56,.56Zm55.8-2.93c-2.96,2.96-6.91,4.35-10.79,4.15-3.51-.17-6.96,.99-9.44,3.48l-1.23,1.23c-2.49,2.49-3.65,5.93-3.48,9.44,.19,3.88-1.19,7.82-4.15,10.79-6.18,6.18-16.66,5.48-21.88-2.11-3.18-4.62-3.27-10.96-.19-15.64,3.02-4.6,7.92-6.78,12.72-6.54,3.51,.17,6.95-.99,9.43-3.48l1.24-1.24c2.48-2.48,3.65-5.92,3.48-9.43-.24-4.8,1.94-9.69,6.54-12.72,4.68-3.08,11.03-2.99,15.64,.19,7.6,5.23,8.3,15.7,2.11,21.88Z'%20/%3e%3c/g%3e%3c/svg%3e)


Showcase
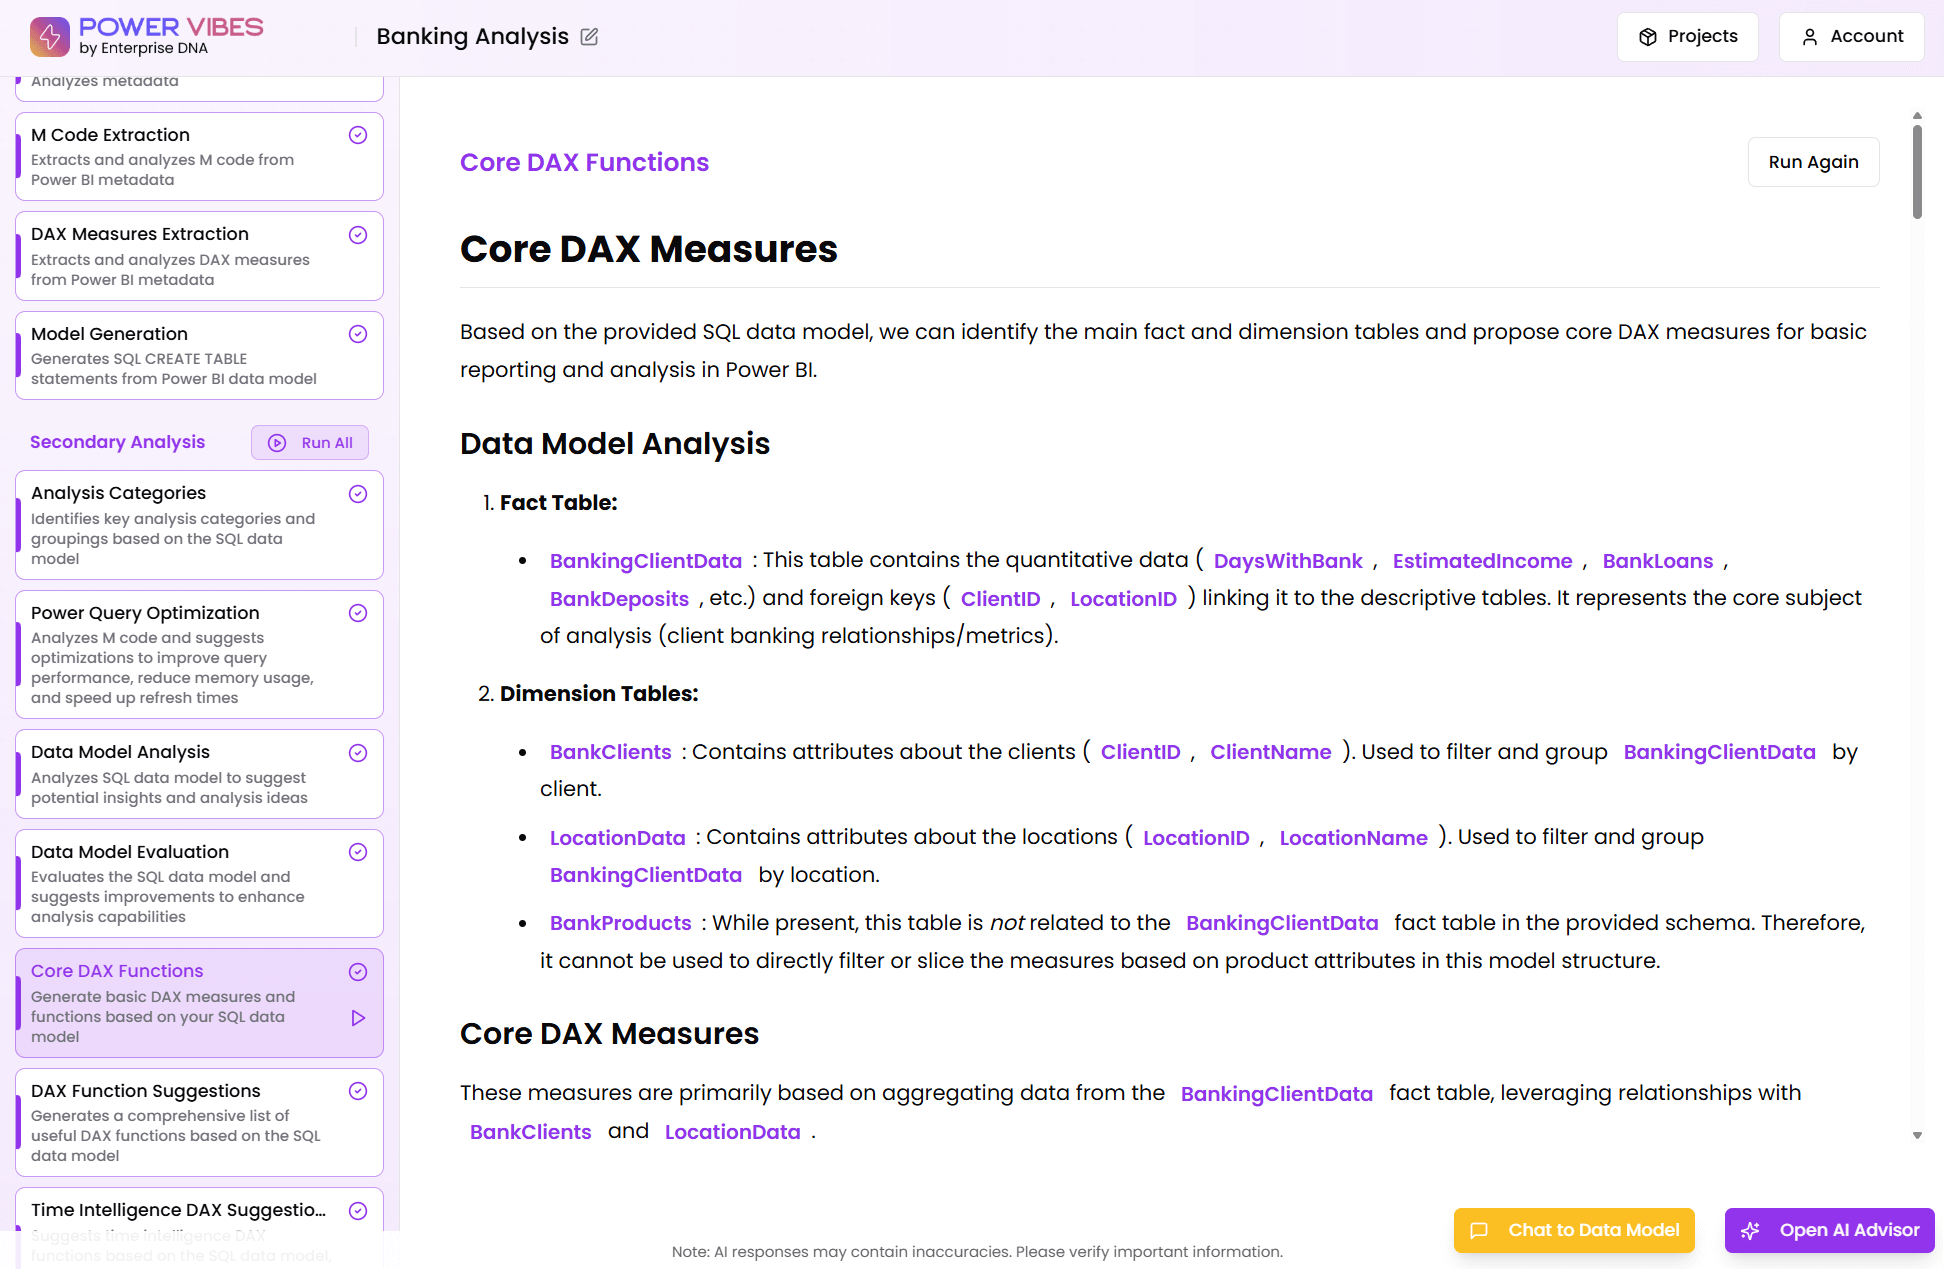
Model Documentation Dashboard
The Model Documentation Dashboard is a user-friendly and minimalist tool that helps users understand complex DAX expressions used in Power BI models. It uses a combo stacked chart to display data in an easy-to-understand format, making it simple to identify trends and patterns. Additionally, the dashboard features descriptions of each DAX expression, providing users with a clear understanding of how the calculations work.
The Model Documentation Dashboard is designed to be highly intuitive, with a clean and simple layout that allows users to quickly find the information they need. The dashboard's minimalist design makes it easy to navigate, even for users who are not familiar with DAX expressions. The combo stacked chart provides a clear visualization of the data, allowing users to easily see how different factors are affecting their models.

What our Students Say
Latest Showcases
Loading
Frequently Asked
Questions
What’s the difference between a free account and a paid plan?
Do I need to know anything about data science or data analytics to get started with Enterprise DNA?
How will I be charged?
Can I get an invoice for my company?
Are refunds available?
Will AI take over the world and make data skills worthless?
Get full access to unparalleled
training & skill-building resources

FOR INDIVIDUALS
Enterprise DNA
For Individuals
Empowering the most valuable data analysts to expand their analytical thinking and insight generation possibilities.
Learn MoreFOR BUSINESS
Enterprise DNA
For Business
Training, tools, and guidance to unify and upskill the data analysts in your workplace.
Learn More