;%20}%20%3c/style%3e%3clinearGradient%20id='linear-gradient'%20x1='2.99'%20y1='29.35'%20x2='127.75'%20y2='101.39'%20gradientUnits='userSpaceOnUse'%3e%3cstop%20offset='0'%20stop-color='%23f2b347'%20/%3e%3cstop%20offset='.5'%20stop-color='%23ca5a8b'%20/%3e%3cstop%20offset='1'%20stop-color='%236654f5'%20/%3e%3c/linearGradient%3e%3c/defs%3e%3cg%20id='Layer_1-2'%20data-name='Layer%201'%3e%3cpath%20class='cls-1'%20d='M83.56,0H47.18C21.12,0,0,21.12,0,47.18v36.38c0,26.06,21.12,47.18,47.18,47.18h36.38c26.06,0,47.18-21.12,47.18-47.18V47.18C130.74,21.12,109.62,0,83.56,0ZM20.62,48.64c2.84-2.84,6.59-4.23,10.32-4.17,3.82,.07,7.55-1.1,10.25-3.8l.56-.56c2.7-2.7,3.86-6.43,3.8-10.25-.07-3.73,1.32-7.47,4.17-10.32,6.18-6.18,16.66-5.48,21.88,2.11,3.18,4.62,3.27,10.96,.19,15.64-3.02,4.6-7.92,6.78-12.72,6.54-3.51-.17-6.95,.99-9.43,3.48l-1.24,1.24c-2.48,2.48-3.65,5.92-3.48,9.43,.24,4.8-1.94,9.7-6.54,12.72-4.68,3.08-11.03,2.99-15.64-.19-7.6-5.23-8.29-15.7-2.11-21.88Zm33.7,34.25c-2.7,2.7-3.86,6.43-3.8,10.25,.07,3.73-1.32,7.47-4.17,10.32-6.18,6.18-16.66,5.48-21.88-2.11-3.18-4.62-3.27-10.96-.19-15.64,3.02-4.6,7.92-6.78,12.72-6.54,3.51,.17,6.94-.99,9.43-3.48l1.24-1.24c2.48-2.48,3.65-5.92,3.48-9.43-.24-4.8,1.94-9.7,6.54-12.72,4.68-3.08,11.03-2.99,15.64,.19,7.6,5.23,8.3,15.7,2.11,21.88-2.84,2.84-6.59,4.23-10.32,4.17-3.82-.07-7.55,1.1-10.25,3.8l-.56,.56Zm55.8-2.93c-2.96,2.96-6.91,4.35-10.79,4.15-3.51-.17-6.96,.99-9.44,3.48l-1.23,1.23c-2.49,2.49-3.65,5.93-3.48,9.44,.19,3.88-1.19,7.82-4.15,10.79-6.18,6.18-16.66,5.48-21.88-2.11-3.18-4.62-3.27-10.96-.19-15.64,3.02-4.6,7.92-6.78,12.72-6.54,3.51,.17,6.95-.99,9.43-3.48l1.24-1.24c2.48-2.48,3.65-5.92,3.48-9.43-.24-4.8,1.94-9.69,6.54-12.72,4.68-3.08,11.03-2.99,15.64,.19,7.6,5.23,8.3,15.7,2.11,21.88Z'%20/%3e%3c/g%3e%3c/svg%3e)


Showcase
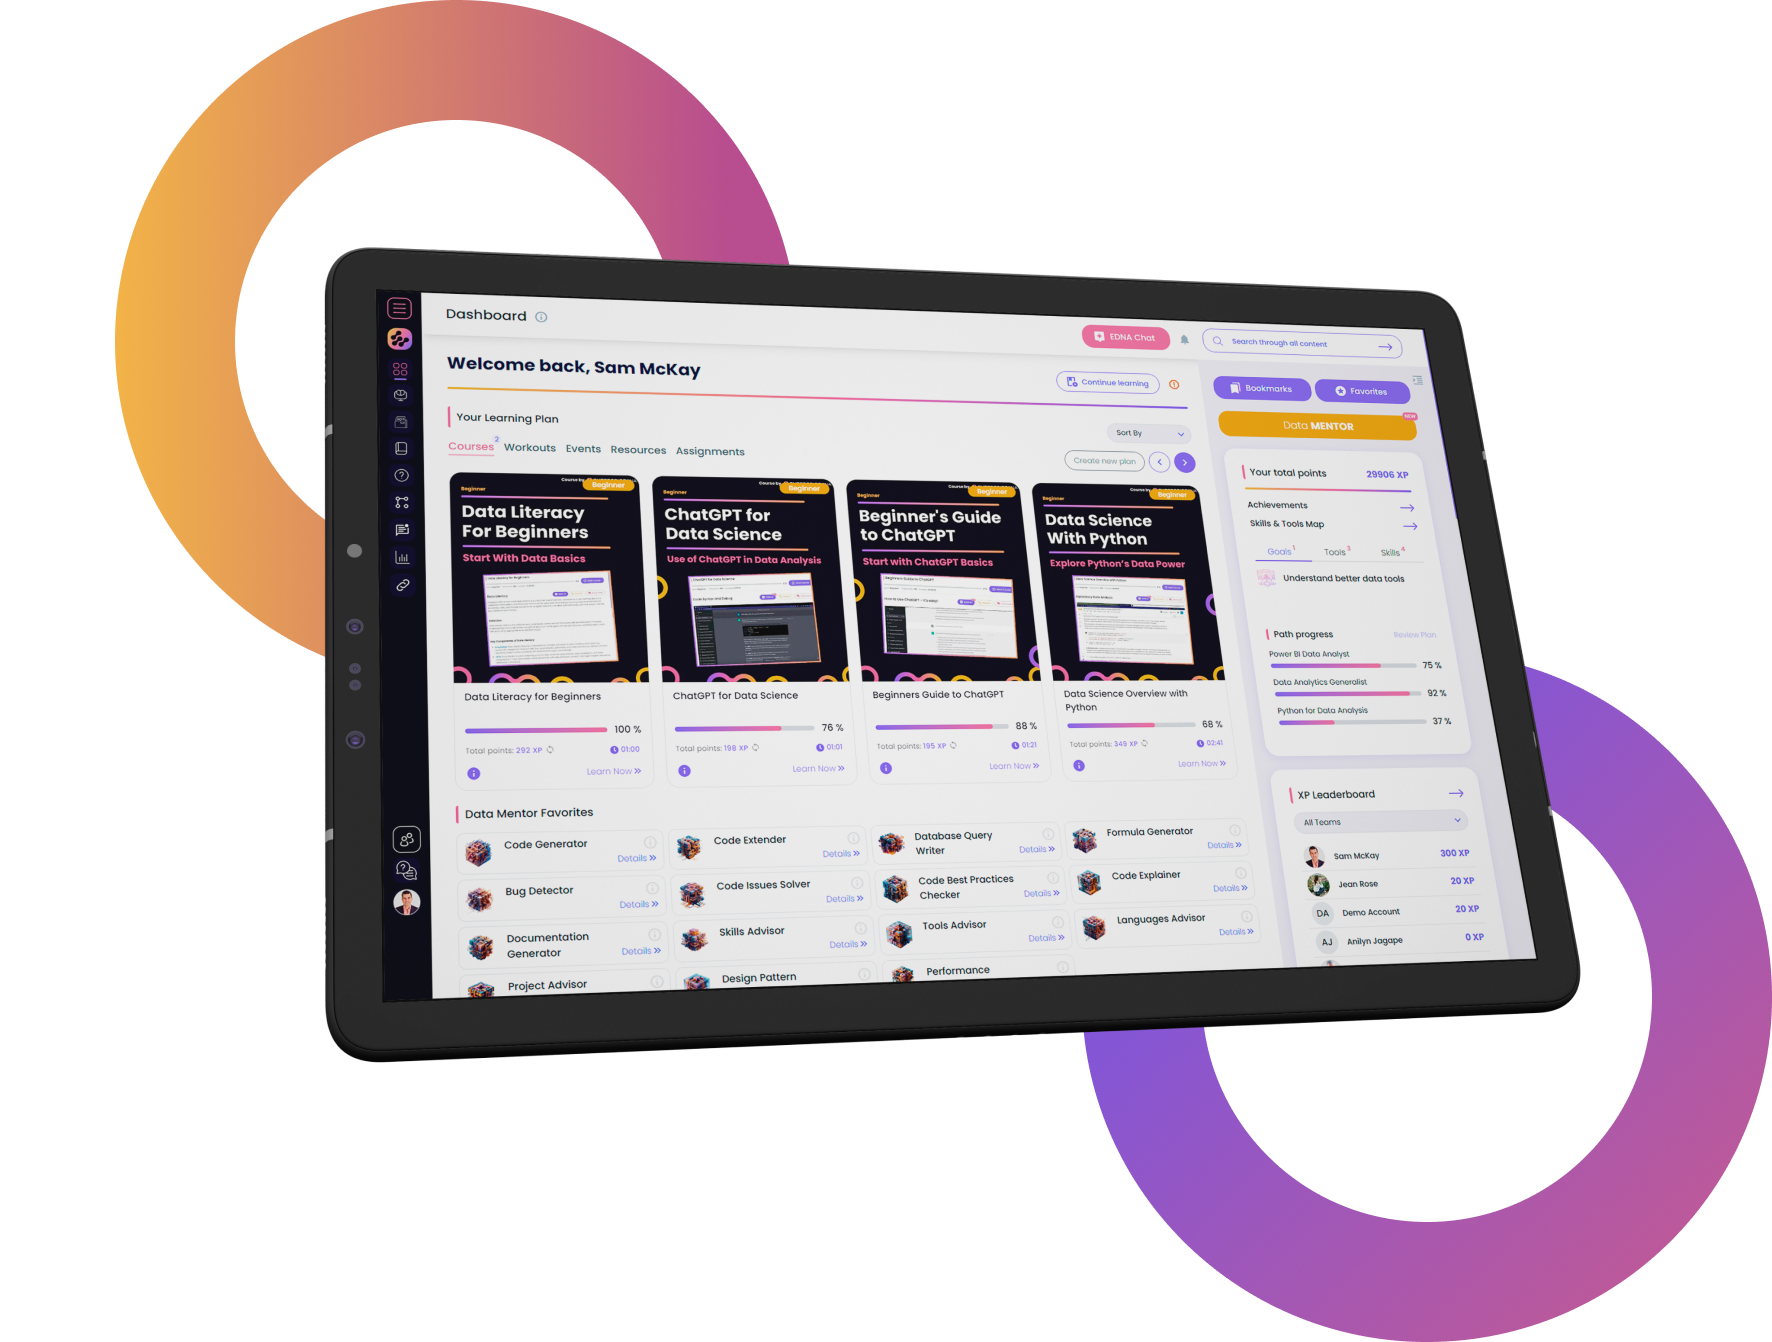
Sales and Production Dashboard
The Sales and Production Dashboard is an easy-to-navigate report that makes good use of icons and native visuals. The report provides users with an overview of key performance metrics, such as revenue, cost, and profit, enabling them to quickly identify areas of improvement and optimize their operations.
With an emphasis on data visualization, the report provides valuable insights into key performance indicators, highlighting trends and patterns that can help businesses make informed decisions. The Sales and Production Dashboard's user-friendly interface enables users to easily drill down into specific data points and analyze them from various angles, making it an essential tool for businesses looking to optimize their operations.

What our Students Say
Latest Showcases
Loading
Frequently Asked
Questions
What’s the difference between a free account and a paid plan?
Do I need to know anything about data science or data analytics to get started with Enterprise DNA?
How will I be charged?
Can I get an invoice for my company?
Are refunds available?
Will AI take over the world and make data skills worthless?
Get full access to unparalleled
training & skill-building resources
FOR INDIVIDUALS
Enterprise DNA
For Individuals
Empowering the most valuable data analysts to expand their analytical thinking and insight generation possibilities.
Learn MoreFOR BUSINESS
Enterprise DNA
For Business
Training, tools, and guidance to unify and upskill the data analysts in your workplace.
Learn More