;%20}%20%3c/style%3e%3clinearGradient%20id='linear-gradient'%20x1='2.99'%20y1='29.35'%20x2='127.75'%20y2='101.39'%20gradientUnits='userSpaceOnUse'%3e%3cstop%20offset='0'%20stop-color='%23f2b347'%20/%3e%3cstop%20offset='.5'%20stop-color='%23ca5a8b'%20/%3e%3cstop%20offset='1'%20stop-color='%236654f5'%20/%3e%3c/linearGradient%3e%3c/defs%3e%3cg%20id='Layer_1-2'%20data-name='Layer%201'%3e%3cpath%20class='cls-1'%20d='M83.56,0H47.18C21.12,0,0,21.12,0,47.18v36.38c0,26.06,21.12,47.18,47.18,47.18h36.38c26.06,0,47.18-21.12,47.18-47.18V47.18C130.74,21.12,109.62,0,83.56,0ZM20.62,48.64c2.84-2.84,6.59-4.23,10.32-4.17,3.82,.07,7.55-1.1,10.25-3.8l.56-.56c2.7-2.7,3.86-6.43,3.8-10.25-.07-3.73,1.32-7.47,4.17-10.32,6.18-6.18,16.66-5.48,21.88,2.11,3.18,4.62,3.27,10.96,.19,15.64-3.02,4.6-7.92,6.78-12.72,6.54-3.51-.17-6.95,.99-9.43,3.48l-1.24,1.24c-2.48,2.48-3.65,5.92-3.48,9.43,.24,4.8-1.94,9.7-6.54,12.72-4.68,3.08-11.03,2.99-15.64-.19-7.6-5.23-8.29-15.7-2.11-21.88Zm33.7,34.25c-2.7,2.7-3.86,6.43-3.8,10.25,.07,3.73-1.32,7.47-4.17,10.32-6.18,6.18-16.66,5.48-21.88-2.11-3.18-4.62-3.27-10.96-.19-15.64,3.02-4.6,7.92-6.78,12.72-6.54,3.51,.17,6.94-.99,9.43-3.48l1.24-1.24c2.48-2.48,3.65-5.92,3.48-9.43-.24-4.8,1.94-9.7,6.54-12.72,4.68-3.08,11.03-2.99,15.64,.19,7.6,5.23,8.3,15.7,2.11,21.88-2.84,2.84-6.59,4.23-10.32,4.17-3.82-.07-7.55,1.1-10.25,3.8l-.56,.56Zm55.8-2.93c-2.96,2.96-6.91,4.35-10.79,4.15-3.51-.17-6.96,.99-9.44,3.48l-1.23,1.23c-2.49,2.49-3.65,5.93-3.48,9.44,.19,3.88-1.19,7.82-4.15,10.79-6.18,6.18-16.66,5.48-21.88-2.11-3.18-4.62-3.27-10.96-.19-15.64,3.02-4.6,7.92-6.78,12.72-6.54,3.51,.17,6.95-.99,9.43-3.48l1.24-1.24c2.48-2.48,3.65-5.92,3.48-9.43-.24-4.8,1.94-9.69,6.54-12.72,4.68-3.08,11.03-2.99,15.64,.19,7.6,5.23,8.3,15.7,2.11,21.88Z'%20/%3e%3c/g%3e%3c/svg%3e)


Power BI for Data Science: From Data to Insights
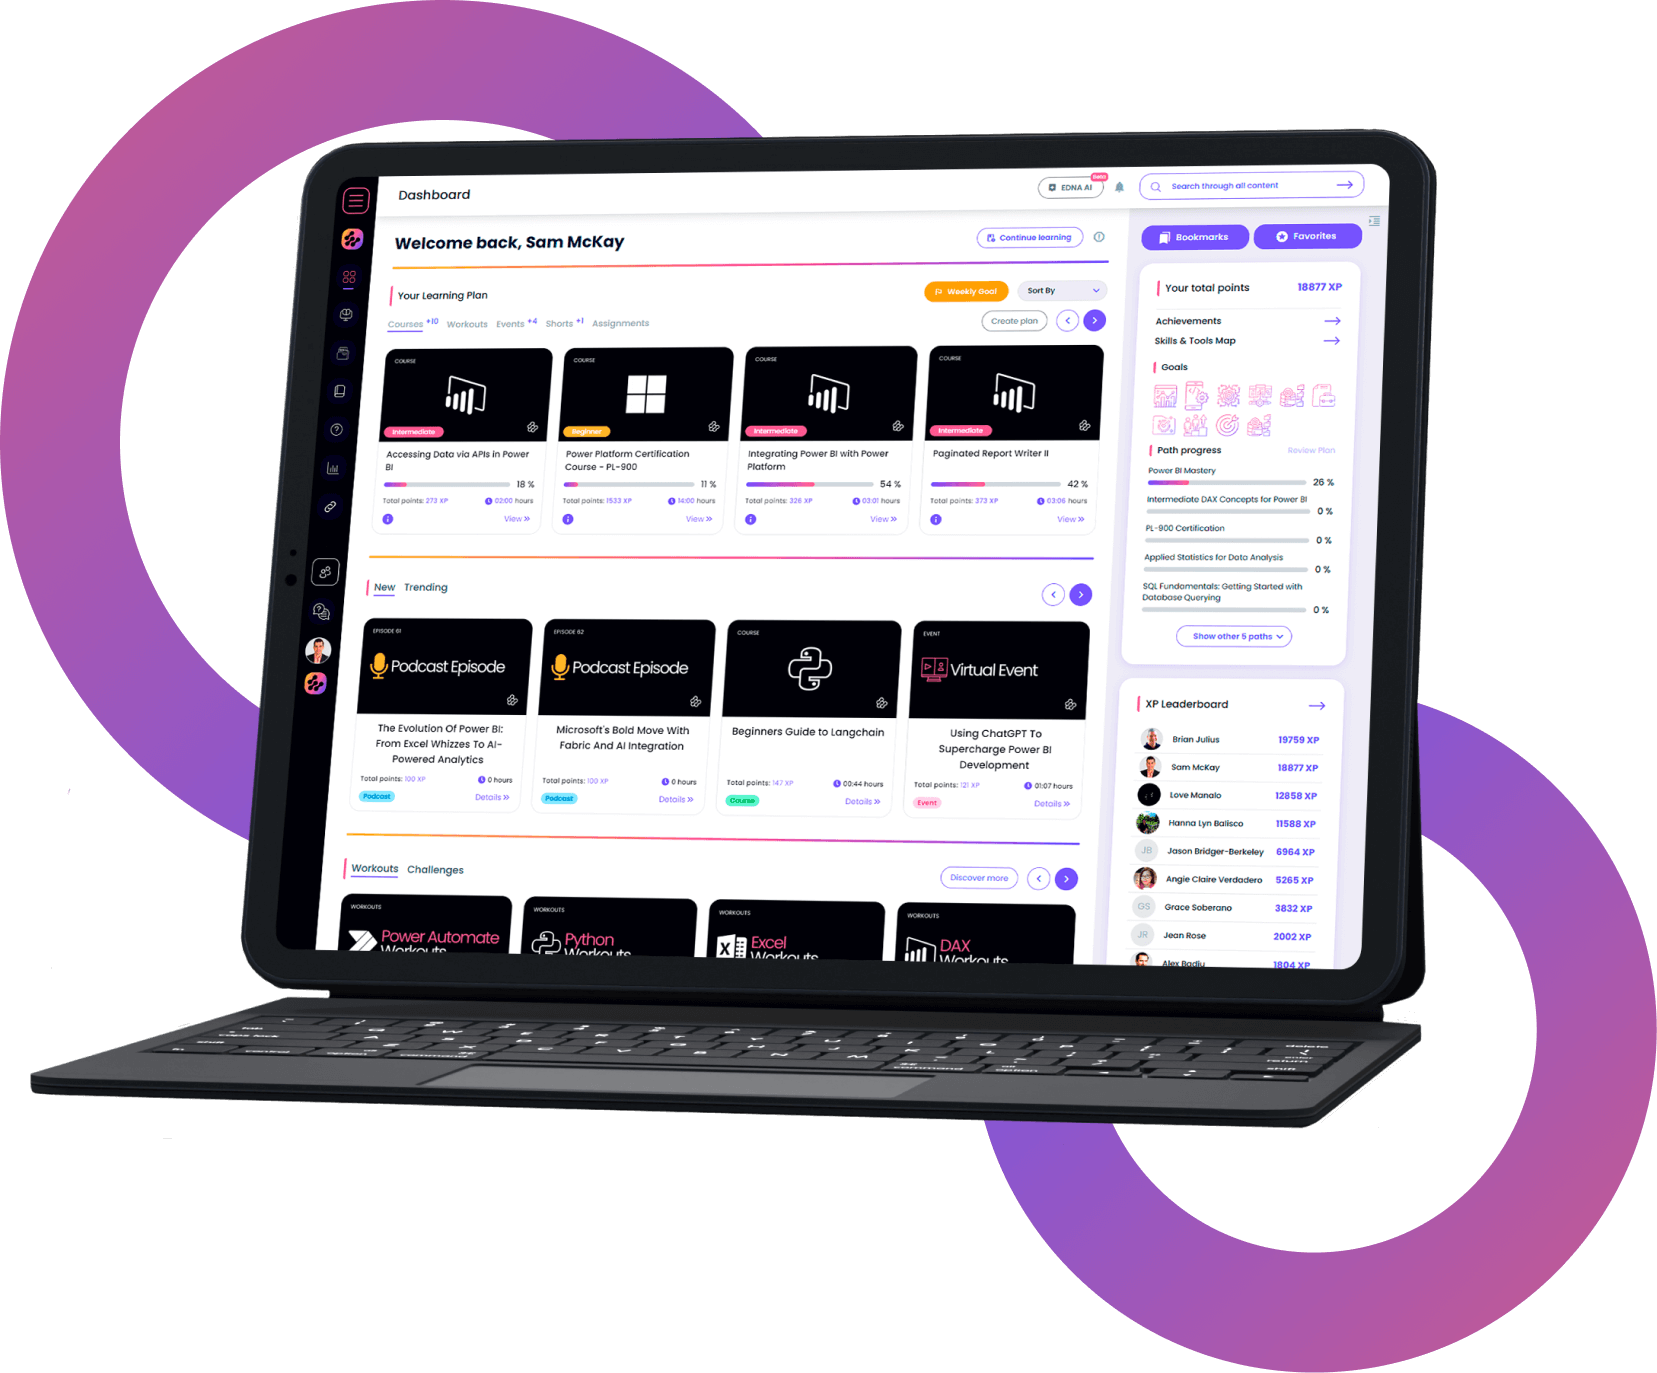
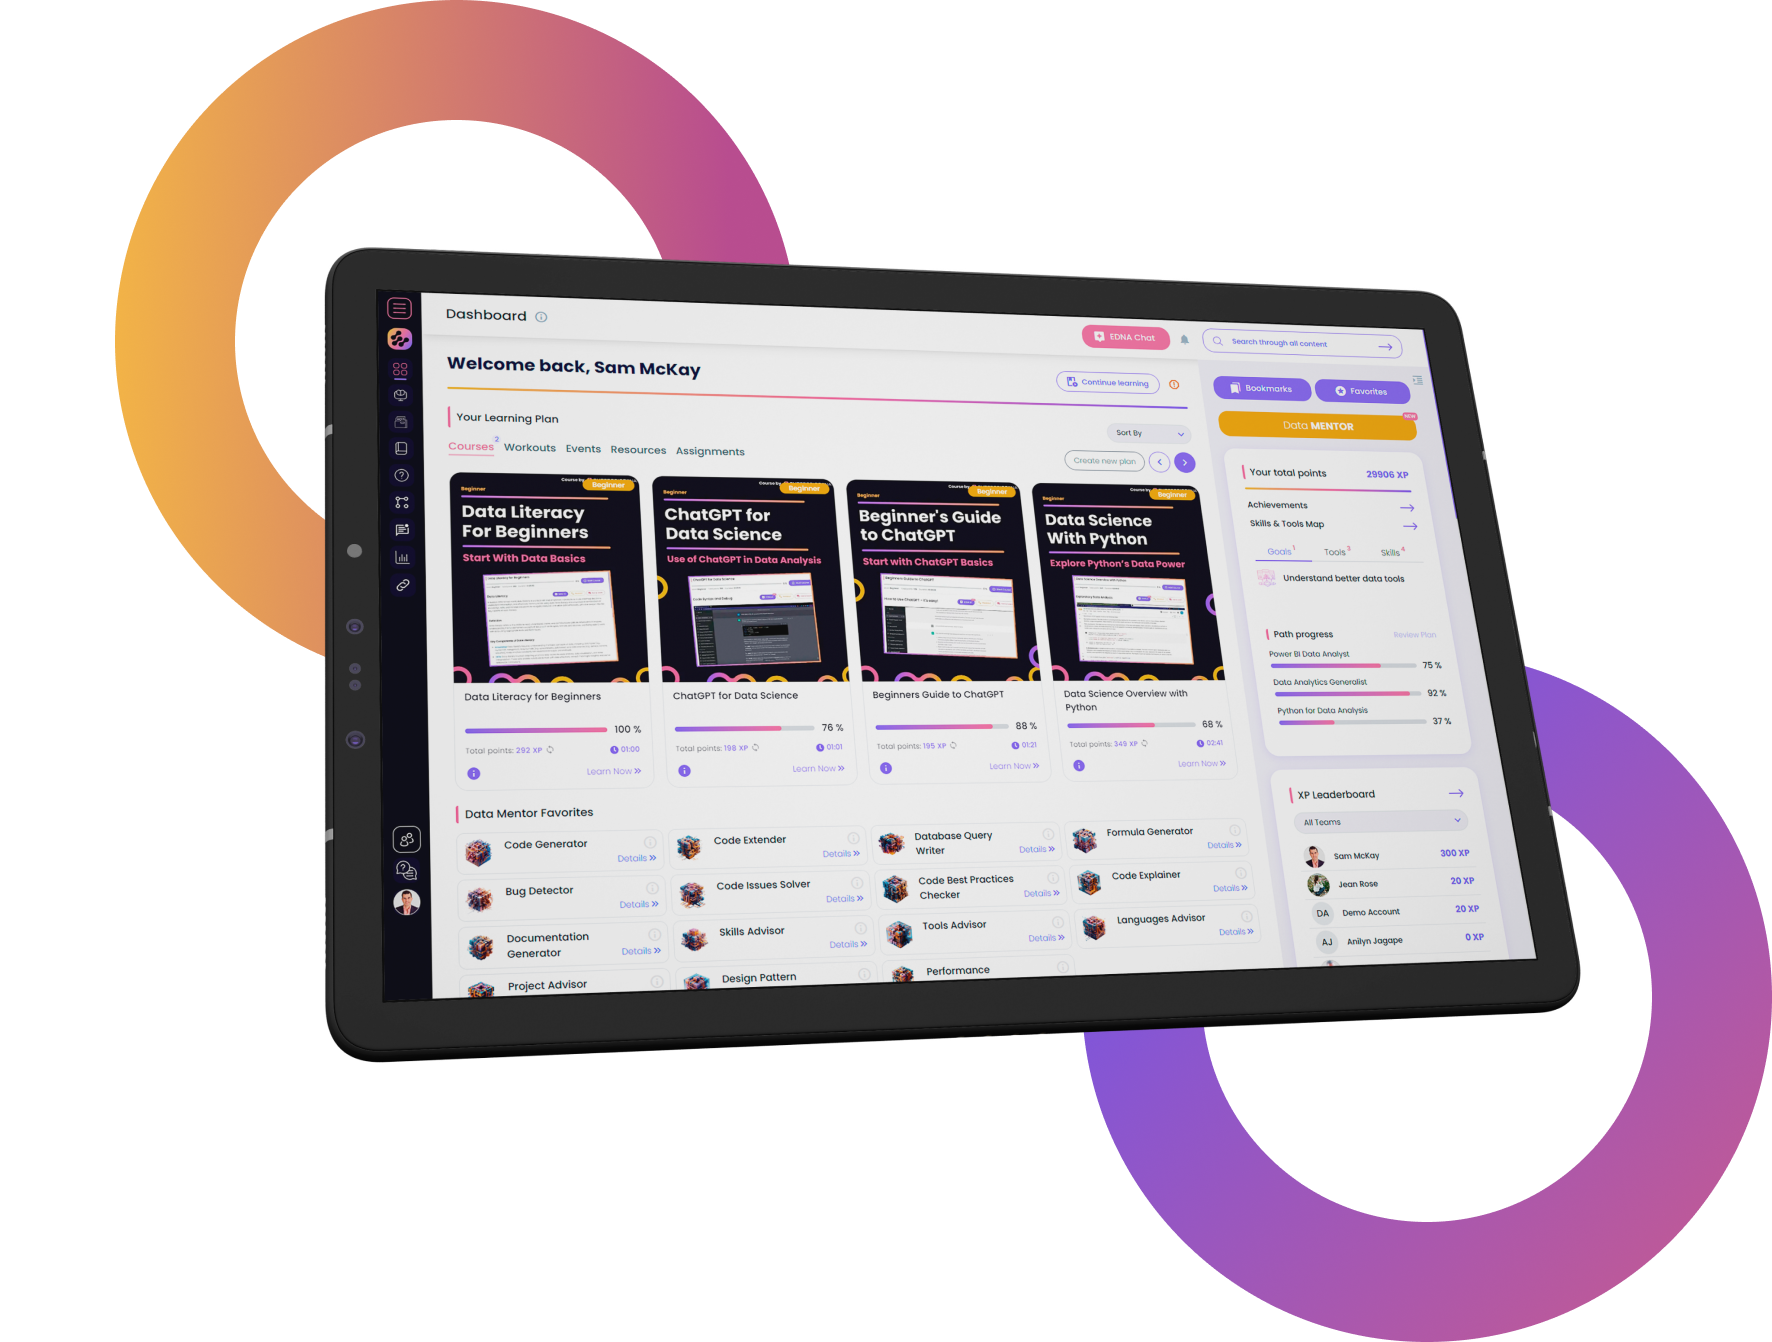
About This Path
In this learning path, you will learn and master a framework for developing high-quality reports and visualizations using R, Python, and Power BI. You will be guided through real-world development scenarios, showcasing how to tell better stories with your data.
This path focuses on complementing Power BI with R and Python, focusing on use cases like data visualization and integration of these tools with Power BI. By learning and implementing this best practice framework, you can create compelling reporting applications with Power BI.
Who Should Take This Path
- Individuals eager about analyzing data and creating insights with Power BI, R, and Python.
- Professionals who want to maximize the potential of their organization's data assets.
- Professionals who want to drive better business decisions using data.
- Those interested in topics like machine learning and inferential statistics.
What Are The Path Requirements
- Familiarity with R and Python programming languages.
- Familiarity with packages like dplyr, tidyverse, skim R, seaborn, and matplotlib would be beneficial.
- A Power BI account for Power BI Desktop and Power BI Service is required.
- Understanding of concepts like hypothesis testing and p-values would be beneficial.

Python-Powered Power BI: Data Wrangling & Visualization
Dramatically enhance Power BI's capabilities by incorporating Python's flexible and powerful data wrangling, data analysis and data visualization functionality

Advanced Python for Power BI: Data Cleaning & NLP
Unlock the power of Python for data cleaning and Natural Language Processing. Master essential functions, algorithms, and programming methods to level up your skills!

Power BI Boost with R: Stats & Graphics Integration
Amplify your Power BI visualizations with R's comprehensive statistical analysis and graphics language

R Advanced Integration in Power BI: Visualization & Text Analysis
Enhance your Power BI reports and analysis with R's visualization, text analysis and statistical modeling capabilities.
Get full access to unparalleled
training & skill-building resources
FOR INDIVIDUALS
Enterprise DNA
For Individuals
Empowering the most valuable data analysts to expand their analytical thinking and insight generation possibilities.
Learn MoreFOR BUSINESS
Enterprise DNA
For Business
Training, tools, and guidance to unify and upskill the data analysts in your workplace.
Learn More